Keeping Score in Growth

curry 600

Good growth teams live and die by their numbers.

This is by necessity. Technology creates unfair advantages where first place is 10X bigger than 2nd and the rest combined. It’s true for Google, Amazon, Facebook, and other companies already founded today whose name we don’t recognize yet.

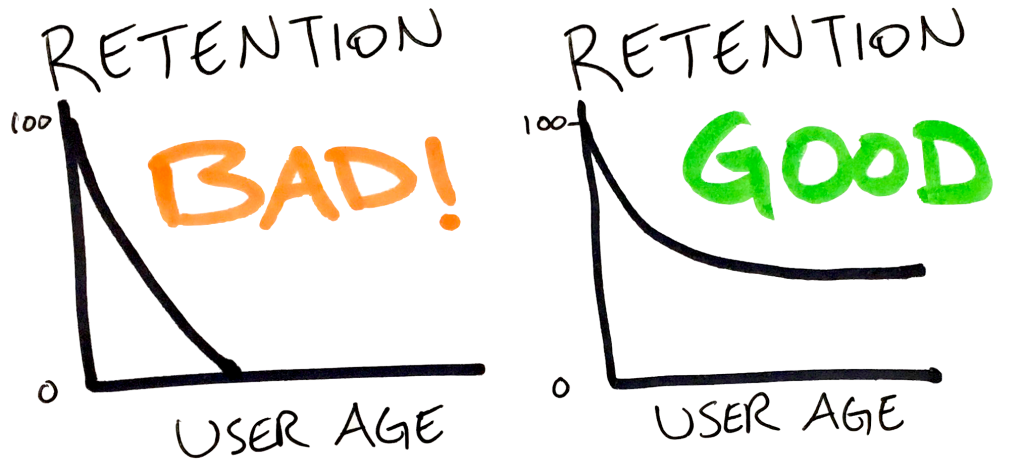
Startups without growth are dead, and the teams tasked with driving growth need to keep score to do their job.

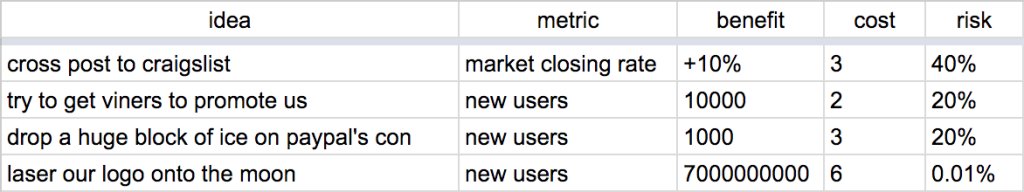
This isn’t just about watching a graph on a dashboard. It’s actually crucial to good decision making. Growth teams should have a clear objective and have understand what levers affect their goal. They should triage ideas by cost, benefit, and risk.

This triage is central to a product team, answering a basic question: what should we do?

Keeping score is the best way to build up a stronger intuition and a comparable history of past projects to help you figure out what to do.
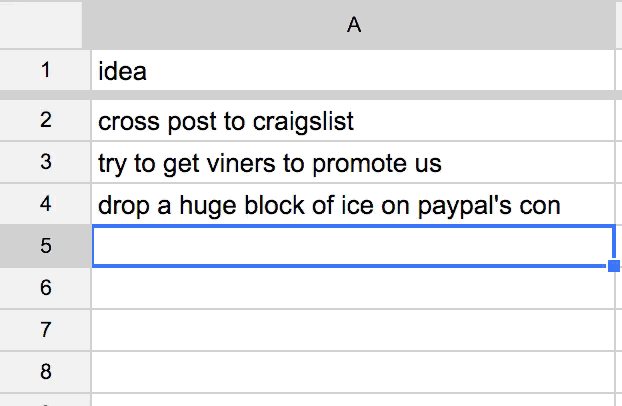
Start Right Now

Take an active project and ask: what will impact might be?

Write it down and share the hypothesis with your team. If you’re working on something without a clear objective, stop working on it. If you don’t have data yet, estimate.

Often you’ll even change how you work in order to measure this result. For example, the best way to measure impact is to run a parallel test with and without the change. Measuring changes in series is a lot harder because of conflating variables like seasonal changes, a PR hit, or a million other things.

The feedback loop starts when you measure how it went. Were you overly optimistic or pessimistic? In what time frame? Where there any side effects?

It’s also crucial to ask why. This is especially true if the test didn’t work. You had a hypothesis, the data has proven it wrong, and now you need to rebuild your intuition that created that hypothesis.

A virtuous cycle starts when you measure results. If things went up, you directly win. Either way, you build intuition and understanding. Then when planning what to do next, you make more informed decisions. More things you work on start to win. You get better faster.

Harder Than it Sounds

These ideas sound simple. But in practice, I’ve seen problems on product teams keeping score.

The aggressive operators on growth teams want to move the needle. That makes the work fast and frenetic. The problem seems to be that people want to move on to the next task to get more done rather than dwell on the past and measure what you already finished. That is such short term optimization.

How & Where

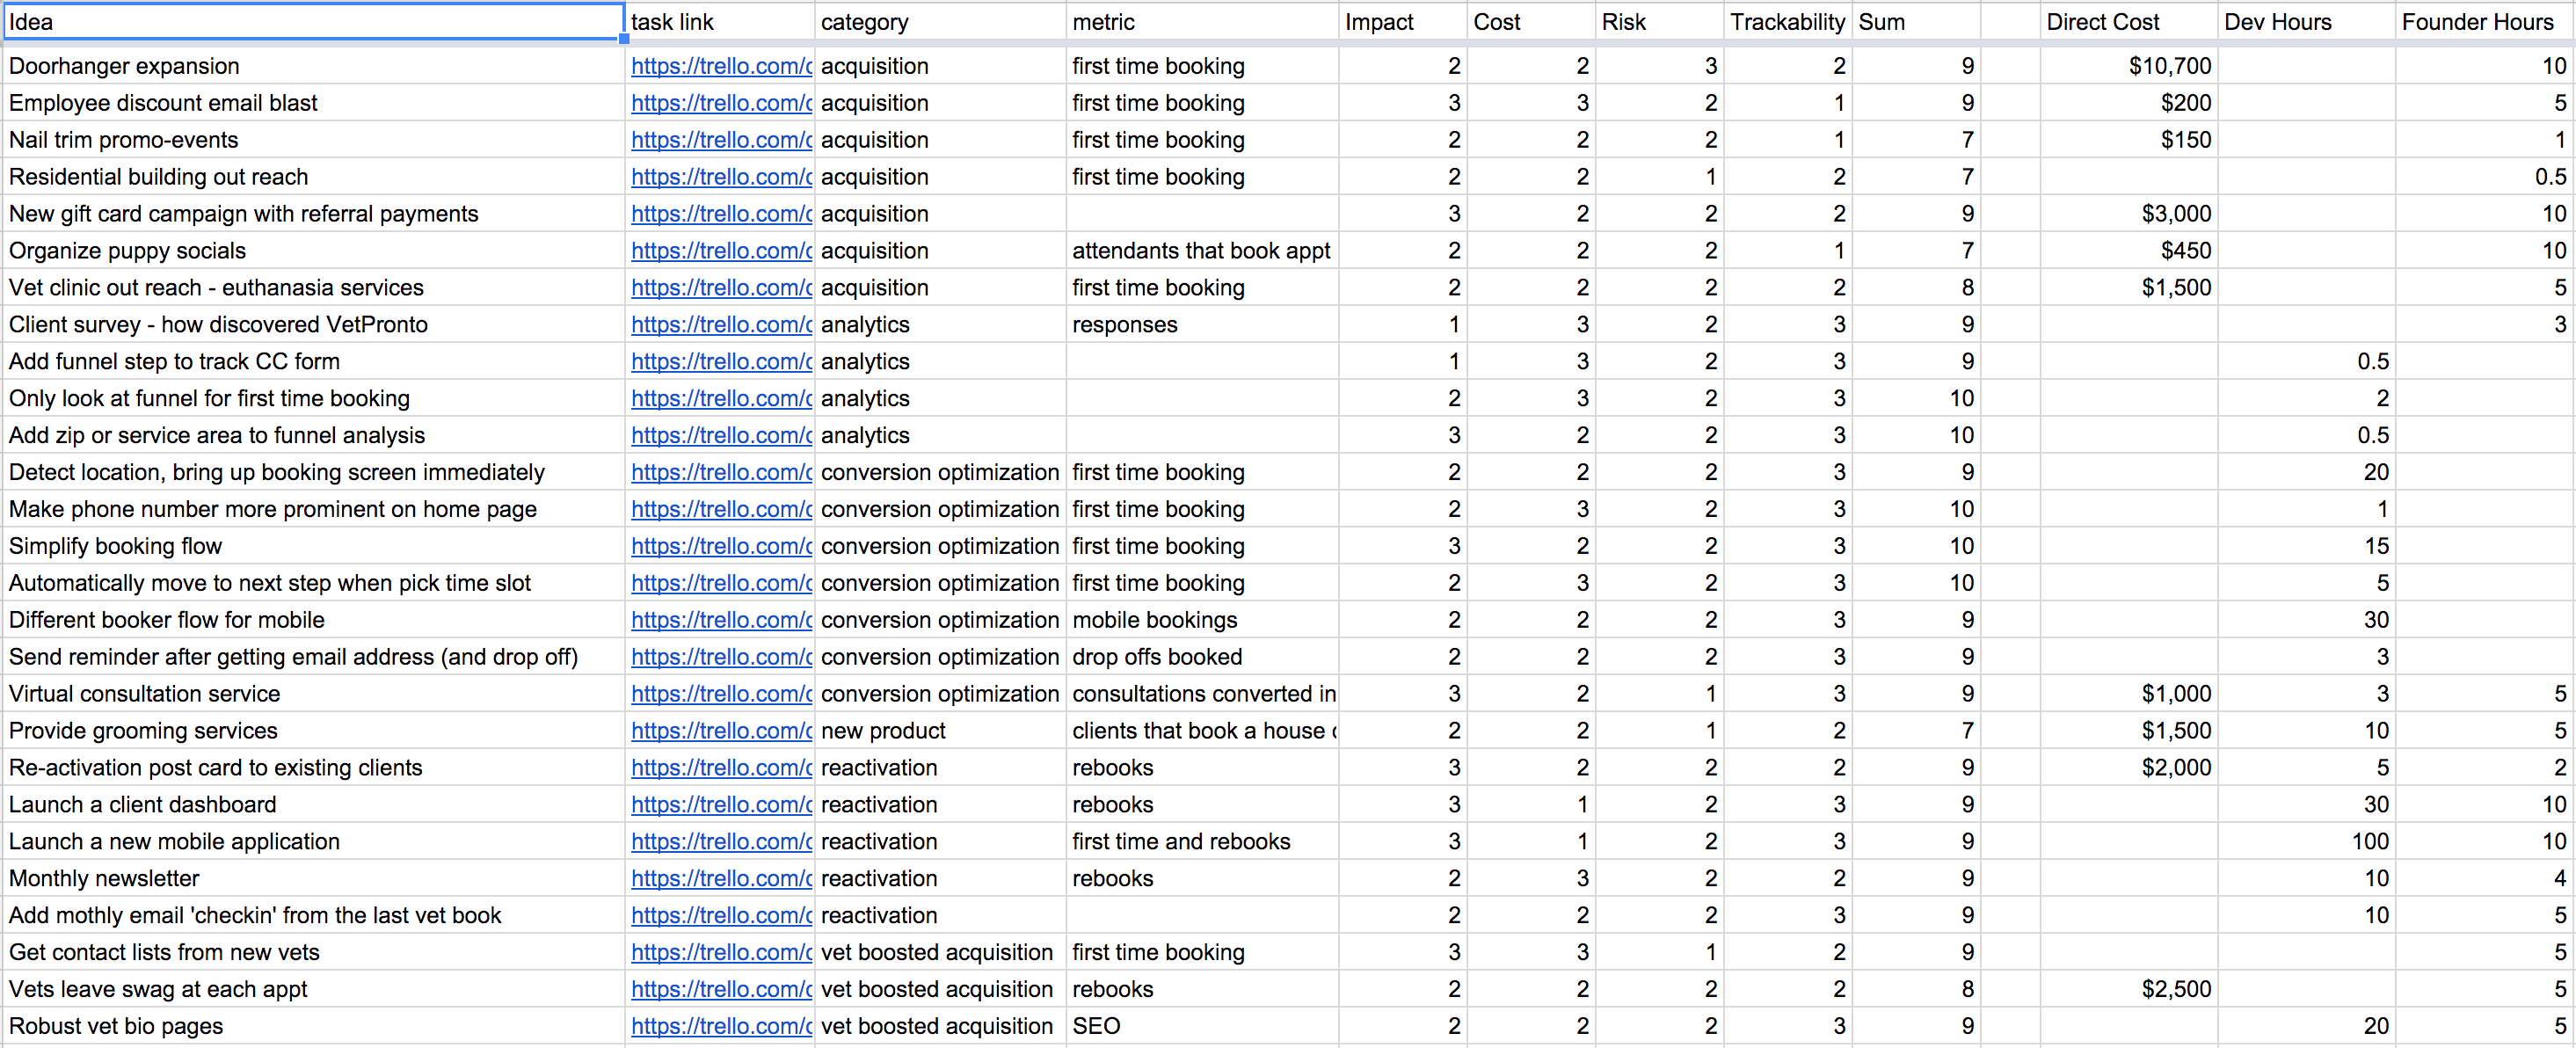
When you’re coming up with ideas on what to work on next, write down why you want to work on them. Get quantitative with how specific metrics will change. For comparing tasks, a simple spreadsheet works fine.

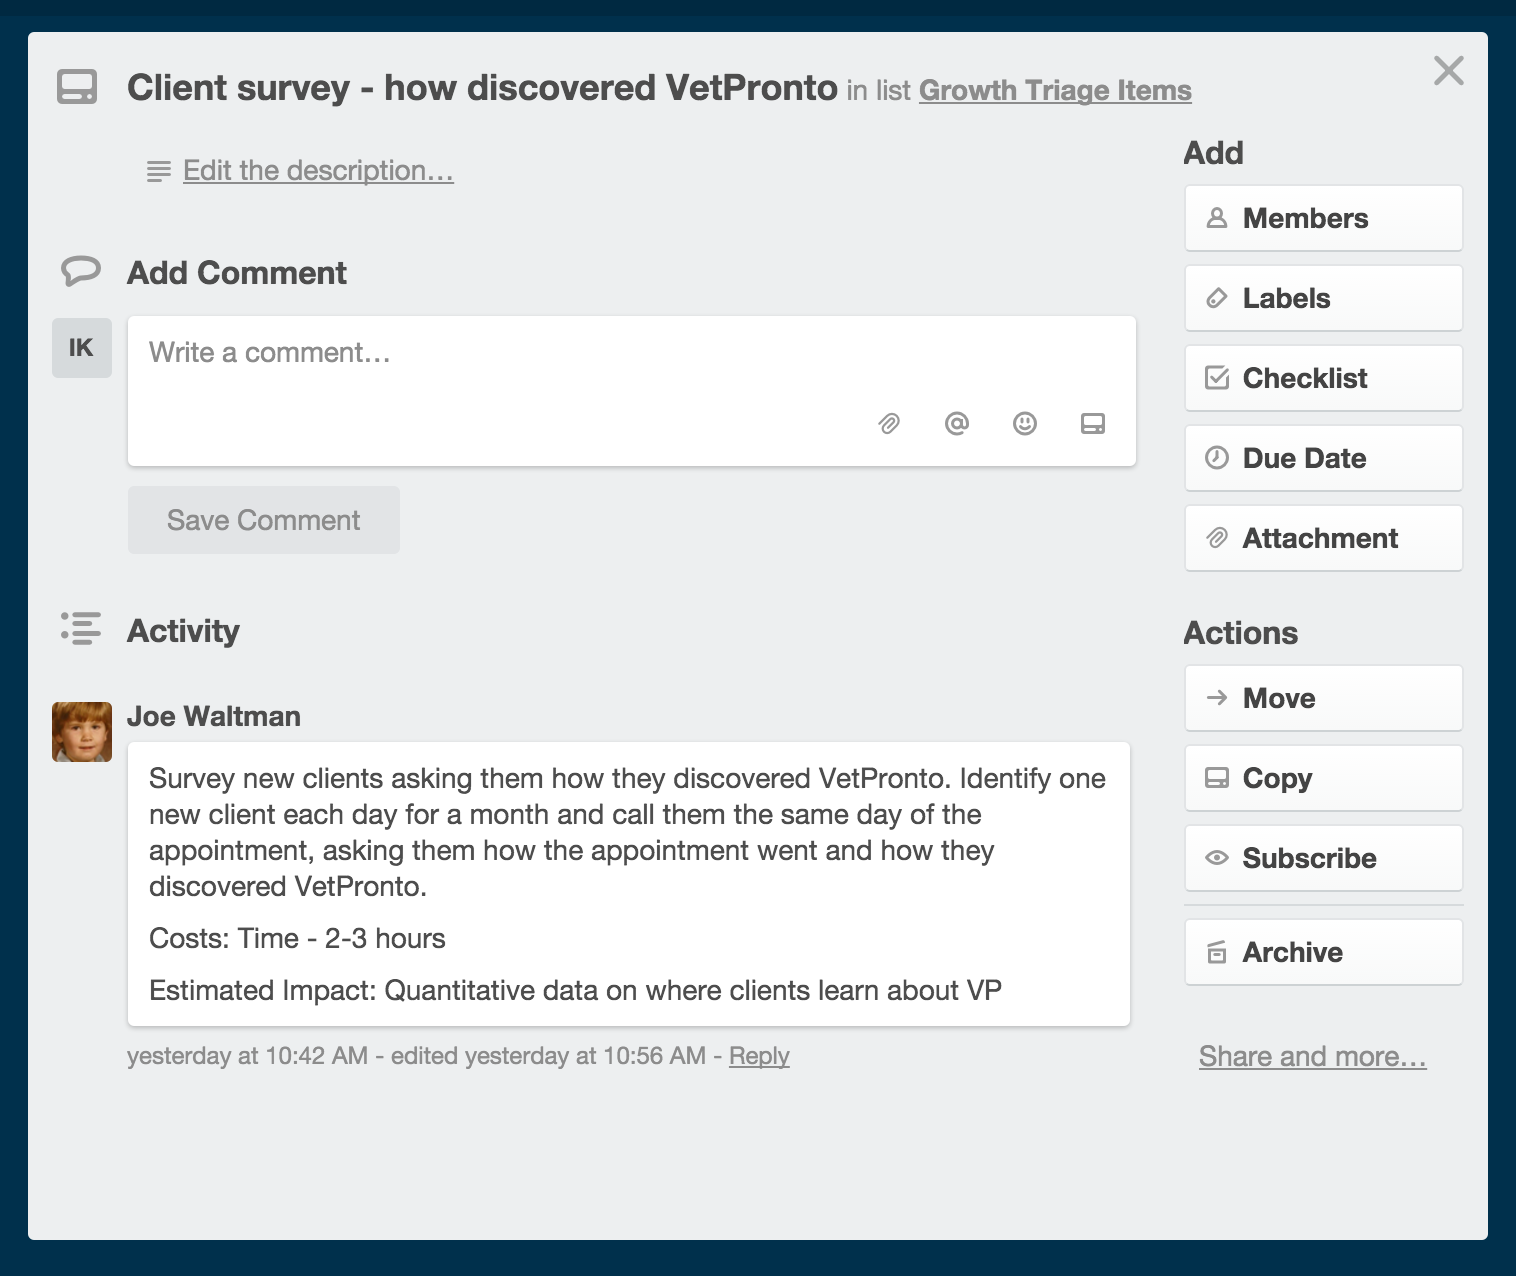
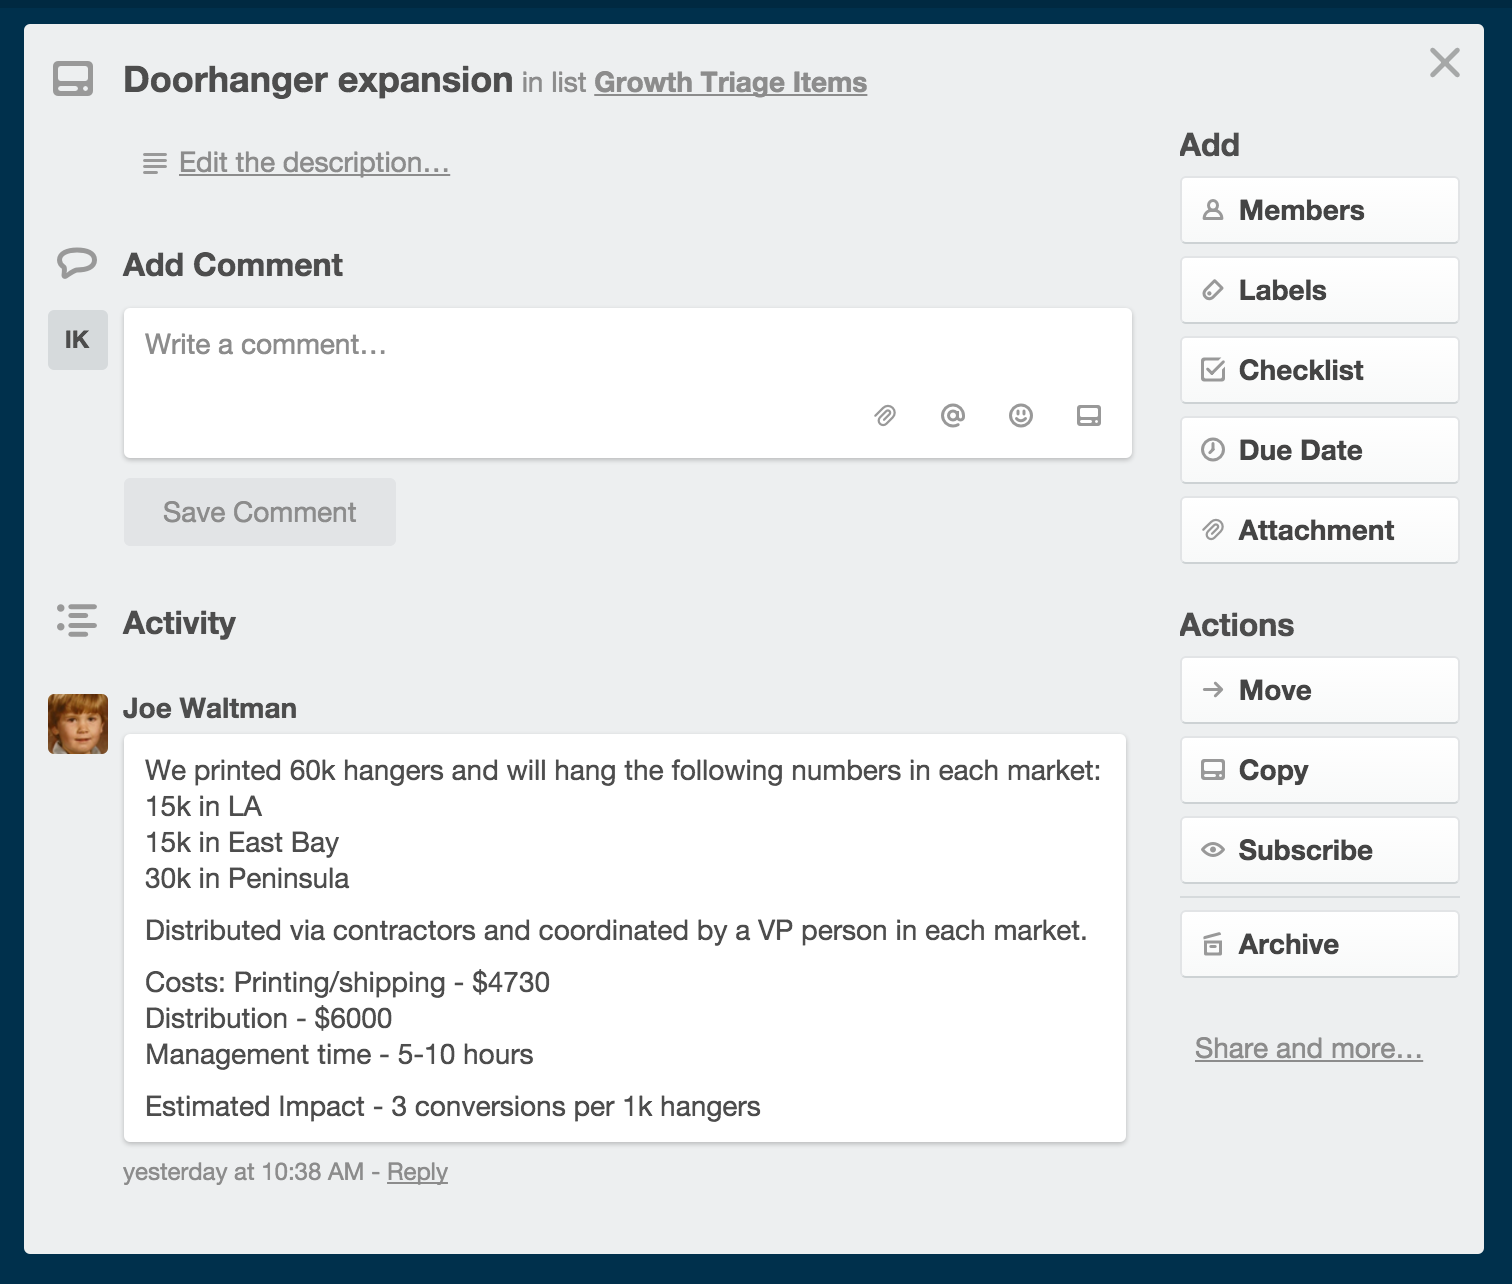
When you’re digging into a project, elaborate on what will change and why. Idealy link to evidence like the past performance of a similar project. For example, if last time you launched a new feature and emailed your users about it, what percentage of users engaging with the email used the product? This data can be used to predict how a new product announcement might be received. This probably lives in a product spec, which for me is either an asana task or google doc.

Post launch, go back to that hypothesis. Revisit the product spec and write down what actually happened.

This is true for both costs and benefits, like the time it takes to get something done. Check out this great post by Joel Spolsky on evidence based scheduling for predicting how long something will take to implement.

There are other ways of keeping score too, and they might influence culture event more. If you routinely do standups or all-hands or Q&As, talk about real numbers and wins. That kind of succinct public record keeping helps everyone understand that you’re here to win and take the challenge seriously.

Ringing the Gong

Speaking of culture, there is a fun anecdote from Facebook. Like many companies, Facebook would celebrate product launches. The “move fast and break things” culture was very powerful, and celebrating big launches is part of encouraging that idea.

They had a huge gong. When a huge product effort finished and launched, the product, design, and engineering leads would get up in front of everyone and hit the gong. The feature management systems were really robust so they could literally turn on the feature for users right when hitting the gong.

But the growth team at Facebook was different. They bragged that they never hit the gong. The thinking was that if they ever worked heads down for months on a huge product launch, there was almost no chance the effort was worth it. They were all about the incremental improvements over time.

Don’t just copy Facebook – find what works best for your team and company.

Putting It All Together

This is the fifth post in a series about growth. Subscribe here to get the next post right in your inbox.

We’re also putting together a class on growth which covers this whole process and more. This will launch in a few weeks, so subscribe to learn more.

If you’re building a referral program, you must read this first.

Two of the best referral programs on the web are from Dropbox and Airbnb. Have you noticed that they look really similar?

referrals

The reason is that both growth teams that build them are constantly optimizing, and they’ve reached the same conclusion about what works well.

At YesGraph, we want to make it easy for anyone to have a world class referral program. Our API boosts performance by recommending exactly who a user should invite. But there is more to program than that — often a lot of product work to implement all these great features.

We want to make building a great referral program far easier. Today we’re announcing the YesGraph Javascript SDK — internally nicknamed the SuperWidget™?. On iOS and Android (launching soon!), we built similar SDKs to handle the whole invite flow.

We want one line of code to deliver the same performance as the Dropbox and Airbnb referral programs.

We need your feedback! We’ve put together a super short survey here or you can just email us at support@yesgraph.com.

There are lots of design decisions that will impact exactly how integration works. This is a great chance to get exactly what you want built, so we’d love to hear from you!

So go take the survey here: http://goo.gl/forms/JaAMftdDuv

Or just email us at support@yesgraph.com

Growth Teams Must Have Aggressive Parallel Execution

bolt 3

Who is the most aggressive person in your company, driving the hardest to hit your goals?

They say the most aggressive person should be the head of growth, with #2 being the CEO. Growth teams should be so aggressive and autonomous that the only person reeling them in is the CEO.

Your company picks a goal and knows how to move the needle by building a map of the product, analytics, and marketing. You come up with new ideas and triage by cost, benefit, and risk. Next comes execution. Execution needs to be aggressive and parallelized to drive as much learning and experimentation as possible. It’s a race for your life — your startup’s life.

So how do you do it? This is actually a question about how you organize your teams. It’s a question of company culture. We’ll explore these ideas in this post.

Growth Team vs Growth Managers

Should you have a growth team? Or should you have people responsible for growth on individual teams?

For a small startup, the answer is easy: the CEO is the head of growth. You need to know you metrics inside and out. You need to understand the strategy to get traction, and you’re probably the one executing on that mission. You need to deeply care about your customers and understand what makes them tick.

What about larger organizations? The answer isn’t obvious and it probably depends on how your current company is organized.

If there is a dedicated growth team, who triages the product roadmap for other teams? What rubric is used in that triage if not hitting some clear objective? Who owns the metrics?

If you have individual members responsible for growth, how do you test bold new growth ideas that take dedicated resources? How are lessons learned shared across your organization?

When designing the shape of your company, the important part is understanding these tradeoffs and making your objectives clear. You should experiment with changes that fit your company and see what works best.

In-House Growth Consulting

If I were joining a new company without a strong focus on growth, where might I start?

I’d go to every other team and ask two basic questions:

1- What are you working on?

2- What do you think will happen when that launches?

It’s shocking how many companies don’t ask such basic questions. There are a myriad of excuses — maybe focusing on quality over performance. Maybe thinking that a lack of corollary makes predicting the future hard.

Call this out. Prediction is hard, but that’s no excuse.

Going through a product development cycle with these questions in mind gets a company on the right track. After a launch, did things go as expected? Why not? What did we learn? What can you do next time? How can we organize our team in a way to deliver better results? If that worked, what can we do more to double down?

This is how a growth team thinks. Start by asking your product leaders some basic performance focused questions and keeping score.

Analytics Life Blood

Growth teams must make informed decisions to win. Early on, this might be qualitative data from talking to customers. At larger scale, aggregate behavioral data speaks volumes.

How are questions answered in your company? Put aside the mechanics, though they do matter. This isn’t about your analytics tech stack. If someone on your team has a product question, what do they need to do to get an answer?

Can they get an answer themselves? Do they need to be in good graces with Bob running the analytics servers? Do they need to know SQL? How are questions triaged? How are answers shared?

Build an organization where the cost of asking questions is as low as possible. Friction means some questions just won’t get asked and you’re on track to building a culture where data, even anecdotal from customers, isn’t needed to make decisions.

I’ve seen different organizations deal with this in different ways. Certainly there are instrumentation and exploration tools that can be bought or built to enable teams to answer questions. The collaborative side to these tools is the most interesting.

Dropbox at one point built a system jokingly called Coura. It was simple: ask a analytics question and say why you want to know the answer. When someone was ready to work on it, the system asked if the information was still needed. Anyone could see the other questions asked and their answers. Engineers were confident that the work they’d do to run an analysis was always needed and impactful.

At another company I helped, they built a system for managing complex queries over large data sets. One interesting byproduct was the ability to see the queries others were asking. This become an onboarding tool for product analysts. It wasn’t treated as such, but the teaching and sharing power was incredible.

Such social tools within organizations aren’t developed enough.

There are many vendors selling analytics tools and and business intelligence solutions. Their sales process and user interface distract you from the main issue in deciding what to use:

Product Needs Drive Analytics

Way too often, product teams dig into analytics tools and try to learn what the hell is going on with their product.

This is backwards. You need to start asking questions from the product side and answer in whatever way is possible. This often means writing custom code to get a real answer. This often means adding a new tool to slice and dice your data, or connect multiple data sources together.

Starting from the tool and working through questions doesn’t work well. The reason is that tools are general and not designed specifically for your company. They have a language, and not knowing your dialect means you don’t even think to ask your questions when you start from the tool.

For example, Google Analytics is very focused on pageviews. It doesn’t focus on users and their actions. If you started with GA, you’d be asking the wrong questions and working towards the wrong goals. If you focused on your product and users, you might then instrument the product with something like Mixpanel, and focus on what is really going on.

But even Mixpanel has some strong opinions. They are great at funnels and events. But if you launch a new feature and want to know how that affects retention, their cohort analysis tools aren’t as strong as Amplitude, an upstart analytics tool that focuses a lot more on cohorts.

Whatever the tool, the point is that you should focus on what is really going on with your customers and your product. Trying to understand that will yield questions that some tools can answer and others can’t.

Company Wide Performance Sharing

Some companies are really tight lipped when it comes to performance and revenue. The tide is turning here because there are huge benefits to sharing this information.

One of the easiest ways of building a more data focused product culture is to share performance data.

Dropbox did this with a daily metrics email. They built an in house metrics dashboard, and then took a daily snapshot and emailed it to everyone in the company. They included investors as well.

This has a huge impact on a company because you make what you measure. If you are measuring and sharing growth numbers, everyone in the company will internalize and represent those goals in their work.

This focus on performance was pervasive at Facebook. The whole company understood for years that the goal was to get everyone in the world on Facebook.

Product Specs Run Like Experiments

After you’ve triaged your growth, my specific tactical advice is to run each task as an experiment. You don’t need a PhD — just treat it like a 4th grade science experiment. Write down what you think will happen — something measurable that you can look at after the experiment. This is often a specific metric you hope to improve.

It’s crucial to reflect back on why your hypothesis was right or wrong. Digging into this helps you learn about your product and customers and informs your future product roadmap. We’ll cover this idea more in our next post about growth.

I really like the framework that Brian Balfour has put together here. Check out his talk here about how to run this experimental progress.

Putting It All Together

This is the fourth post in a series about growth. Subscribe here to get the next post right in your inbox.

1-  Pick a Goal

2- Map your Product to your Goal

3- Triage by Cost, Benefit, and Risk

4- Aggressive Parallel Execution (hello there!)

5- Keep Score (coming soon)

We’re also putting together a class on growth which covers this whole process and more. This will launch in a few weeks, so subscribe to learn more.

A YC Company’s Public Product Roadmap

ozzie 2

Last week we wrote about how to create and triage your growth ideas. Read more about our process here. Now we want to follow up with a real example of a startup’s roadmap.

I didn’t want to use YesGraph directly here, because I wouldn’t want the underdogs at Google and Facebook to copy us. But VetPronto is different. 

I first met VetPronto’s founders through YC. We were batchmates in the W15 class. So I was delighted when Joe from VetPronto reached out saying they were up for running a growth triage and publishing it.

VetPronto lets veterinarians make house calls for your pets. Book online, and a vet comes to your house when it’s convenient for you. As a pet owner myself (that’s Ozzie in the pic above), I know this is awesome. It’s painful to schlep your pet to an office just to wait for 20 minutes just to get a single pill or shot.

VetPronto isn’t overly worried about competition because their main problem is customer awareness. When someone books for the first time, they love it and switch to using them again and again, but most pet owners don’t even know this is possible. They’d be delighted if a competitor spent VC dollars teaching the world. So now you can read all their ideas freely!

Plus, they’re going to give a discount to all the growth focused pet lovers out there. Mention “YesGraph” when you book to get $25 off. They only operate in the San Francisco Bay Area and Los Angeles for now.

We followed the same process I recommend in our post about triage. We came up with lots of ideas, categorized them, and then estimated their cost and impact. VetPronto does a lot of ground marketing, like door flyers, so they also added “trackability” as a dimension. Ideas came from walking through the user flow, their current marketing channels that work, and brainstorming new marketing ideas.

Each of these ideas was put into a spreadsheet. Here is a snapshot, click through for full resolution.

Screenshot 2015-12-17 16.45.31

VetPronto likes using Trello, so each idea had a Trello card with more details. Here are two example cards, again click through for full res.

Screenshot 2015-12-17 16.46.07 Screenshot 2015-12-17 16.45.53

Triaging your growth puts your company in a position to work things that actually move the needle.

I’ve done this kind of product roadmap planning many times now. There are different ways to get it done, but let’s review the core parts.

There is far more you could do than you have the resources to do — whether you’re 1 or 1000 people. So you must triage. Triage by potential cost, benefit, and risk. Cost means both money and your team. Benefit means what metric will move if it works. Risk is an estimate of how likely it is to work. Run experiments using science: make a hypothesis and try to prove it right or wrong.

If you’ve run a similar process, I want to hear about it. Leave a comment below or email me at ivan@yesgraph.com

If you want to get future blog posts right to your inbox, subscribe here. Our next growth post will focus on how to organize your growth team to get as much done from your triaged list as possible.

And don’t forget to give VetPronto a try! They’ve been so generous with their transparency — Thanks to Joe and the whole VetPronto Team!

Growth Step #3: How To Triage Your Growth

So you’re trying to grow your app. You have lots of ideas. How should you triage?

We’ve written that Step #1 is picking a goal. Step #2 is building a map to understand how your product features and marketing can improve your goal. Then what do you do? This post is the next in our series about how to grow – subscribe to get all our growth posts here.

ideas

In short, come up with ideas and triage them by cost, benefit, and risk. It’s important to get the details right here so you’re running valuable experiments, so let’s dig in.

Crafting Ideas

My favorite nonfiction book is “Where Good Ideas Come From” by Steven Johnson. It’s a natural history of innovation — describing the environments where that produce good ideas. There are plenty of ideas in the book for how to generate good ideas. Here are few.

Gather information in a liquid network. This means talking to users and people at your company that understand your users and your product. What would they like to see change? You’re not going to work on everything you hear — so just gather the ideas freely.

It’s important to capture the why and not just the what. Often people jump to a specific solution of the problem when the real insight is describing the problem itself. The best way to get to the bottom of this is just asking why.

“Add Facebook for signup.”

“Why?”

“It would make filling out this registration form easier”

“Why?”

“Because you’re asking for a lot! This form is complicated.”

Study the adjacent possible. That means look to see what is possible by putting different parts of the world together. The airplane was the adjacent possible of the craftsmanship of bicycle mechanics and a light gasoline powered internal combustion engine. The simplest example of this for your app is taking an existing flow and trying to improve an element: a call to action, the copy, images, or the design. Or take an email campaign that worked for a past feature and apply it to a new feature.

Copy fearlessly but study first principles. An easy source of ideas is to copy tactics that others have tried. The problem is that what works for others might not work for you. Another problem is that you might be reading the distorted view of an outsider. A good example of bad copying is the way mobile apps bury a prompt to invite friends in a sub-menu — just like Uber does. Uber is a supply constrained marketplace and didn’t optimize the rider invite flow for ages — but dozens of apps didn’t consider that before copying them. Again try to copy the *why*. For example, Dropbox used referrals because the product quality was very high and most users came from word of mouth.

Dig into your data. Besides talking to users, there are plenty of data sources to understand what people do with your product. Sometimes you can find interesting behaviors. At Dropbox, we analyzed the file types and found that photos were popular and numerous. Talking to users showed managing photos is hard. This kind of understanding can help you immensely when you have far too many users to talk to personally.

Don’t just optimize what is there. Some of the greatest ideas are really different than what you currently do. For example, you can generate lots of ideas by walking through web user onboarding and thinking about how each step could be improved. But the best idea could be something totally outside that flow, like a mobile app that doesn’t exist yet.

Distribute across focus areas. Growth isn’t just about user acquisition. You should be concerned with retention and engagement and virality. For YesGraph, we define categories like “developer onboarding” and “ranking performance” and others. Base this on the map you’ve built to know what parts of your product impact your core goal. Making sure you’ve thought about your growth from different angles is a way to encourage lateral thinking and have better ideas.

Triage by Cost, Benefit, and Risk

You don’t need to get fancy about the tools you use here. Just use google docs or quip to make a spreadsheet full of ideas. Use a spreadsheet because you’ll be adding different dimensions, and a flat doc isn’t the best format for such side by side comparisons.

There are three categories.

Cost: how many resources will this take? This means the time your employees spend. It could also mean a dollar cost for, say, an ad campaign. People might have a category too: this might be front end heavy, that might be visual design heavy.

Benefit: if this works, what do we predict will happen? Having a hypothesis before you run a test is basic science, but very few people actually do it. Make an estimate of the impact of your work. This isn’t expected value, but conditional on success.

Risk: how likely is this to work? If you already have an analog, you can have higher confidence a test will work. If you’re working on something totally new, there is much higher risk. An example of a very high risk effort is forking off a dedicated app from your main app. An example of a very low risk effort is testing the copy on a button.

Screenshot 2015-12-11 09.13.11


Estimating the cost is probably the hardest part here because engineers are notoriously bad at figuring out how long something will take. The solution is to write enough detail about an idea so that each part is understood. Break down problems into component parts.

Spreadsheets are good for comparisons, but basic docs are better for more depth about a specific idea. So I usually have a doc full of stub specs. Eventually the stubs get their own doc for an even more product spec.

Balance Incremental With Potentially Explosive

80% of your tasks should be incremental, like running an AB test on an important form in your funnel. 20% of your time should be adding whole new, though risky experiments.

Incremental improvements matter over time. The reason is that if you’re working on the right things then the results are compounding. As we’ve said before, there is no silver bullet to solving your growth. You need to dig in and get to work.

Big risky, efforts can pay off, but being higher risk means that you are risking your company’s growth if you bet excessively on them.

The good news is often you can lower the risk by performing a small test. For example, adding a referral program has a lot of moving parts and takes some work to get right. It turns out you can validate the idea before digging into the hard parts. For example, you can literally add a single email asking users to invite others to see how your userbase would respond to a real program. Read this post for more details on referral tests.

What This All Actually Looks Like

I want to give an example of what this looks like, but a realistic view would require sharing too much of YesGraph’s internal roadmap. I love helping our community grow, but that is a bit too much transparency.

So let’s try something else. If someone wants our help in helping them walk through this process, get in touch: ivan@yesgraph.com. We can help you figure out the possible ideas and triage them. The caveat is that I’ll share your growth roadmap publicly.

We’ll see if we get any takers! What I can do is show what our internal docs look like – literally those pixelated images below.

I have one more thing I want to share here, but we’re not quite ready yet. If you want to see a more detailed breakdown of this process, subscribe to get future posts here.

Screenshot 2015-12-10 16.22.46

Screenshot 2015-12-10 16.23.59

The #1 Mistake in Driving Growth

golden ticket

I’m privileged to talk to hundreds of companies about their growth. YesGraph helps recommend who a user should invite to an app, which is a growth power tool for referral programs and invite flows. Talking about your growth is part of our sales process.

Plus I ran growth at Dropbox, so I get a lot of people asking for advice. This is one reason I write this blog at all — I have a lot of say from this experience.

There is a common pattern among less experienced companies:

People think there is a silver bullet to solve their growth, they just need to find it.

No. Stop it. There is no silver bullet. There is no golden ticket. There is no magical growth hack.

Belief in this fantasy is actively hurting your company. It stops you from digging in and just getting down to work.

But Airbnb used Craiglist… Nope. Airbnb ran very many experiments. They visited their customers. They did things that couldn’t scale like great photography. They built up an amazing community of hosts that still is the hallmark of their brand. Airbnb didn’t have a silver bullet.

But Dropbox and referrals… Nope. I know the inside story here. Dropbox worked tirelessly to smooth out the rough edges of their product. They built something amazingly high quality and people wanted to tell their friends about it. I personally ran dozens of tests to optimize multiple sharing channels. Dropbox didn’t have a silver bullet.

The reason these complex stories get boiled down to something that looks like a silver bullet is because most media about growth and startups is junk written by outsiders. Another reason is that there is a natural audience for such thinking: hopeful founders who want to win. You see this thinking everywhere: money, dieting, dating.

The secret to driving growth is that there is no secret. You need to be humble, dig into your data, run real experiments, and drive to do it again and again. This is the message you’ll hear consistently from people that have done it at Twitter, Facebook, LinkedIn, and other high growth startups.

There are practical frameworks to use that can help run this process. There are many tactics you can use in experiments. That is what we cover on this blog.

For virality, we’ve written about what to measure, testing whether referrals might work, and when to focus on virality.

For growth process, we’ve written about the importance of picking a goal and building a map to understand how to hit your goal.

There is more on the way! We’ll write more about growth, metrics, and virality. High quality content around growth is rare, and our hope is to make it easier to build the next Dropbox or Airbnb.

Click here to receive future posts right in your inbox.

Simulating YC

Right about now, many startups are learning whether they got into Y Combinator’s W16 batch. Congrats to those that got in, and for those that didn’t, please keep going.

Even YC companies try to continue the momentum after Demo Day. So how can you simulate YC — whether you didn’t get in, can’t move to California, or your batch is done?

matrix jump good

This is like software or UI design patterns. If there is a good idea that works, we should make them more common. We’re simulating an accelerator, so this is just another way of exploring how a more startups can win.

For context, my startup YesGraph just went through the W15 batch. It was my second time through, after my first startup Tipjoy was in W08. Plus YesGraph helps apps grow, so I talk to many companies about their growth constantly.

Picking Your Goal

It’s incredibly important to have a true north for growth. I’ve written about how important picking a goal can be for your startup’s growth. Growth solves most problems in startups. You can get a lot wrong and still win because of good growth.

You should work with investors and advisors to pick a goal. It’s something that partners at YC will focus on during office hours. You can revisit whether you’ve picked the right goal, but mainly you’re looking for a baseline for the real work.

Driving Towards a Weekly Growth Target

If you have a goal, then you need to keep score. In group office hours and meetings with partners, YC focuses with brutal honesty on hitting metrics. Many founders describe how motivating this routine can be for maintaining momentum. For example, Airbnb would put their target growth graph everywhere — they couldn’t avoid keeping score and getting motivated.

Startups can be busy and frenetic. Mania about your specific goal actually helps you focus on cutting out everything that doesn’t help achieve the goal. During YC you might even make temporary sacrifices, like not meeting up with friends socially.

Find the right balance for you, but try to cut away everything getting in the way of hitting your goals. This is why so many investors focus on founders that are relentlessly resourceful.

Routinely Meeting With Other Founders

The YC batchmates provide a big part of YC’s value because other founders have your same problems. But they aren’t your investors, your boss, your customers, or your employees. You can be direct and blunt in a way that is very rare compared to your other relationships.

This level of candor helps you be honest with yourself and helps you prioritize. It also helps get feedback and advice from just enough people. Not one person’s opinion and not a crowd that can’t see the future you’re building.

Try to keep this group small — no more than a dozen companies. As groups grow, meetings become cocktail parties not counseling sessions. Harsh feedback is less direct or not given at all. 

Demo Day = Refined Pitch + Meeting Density

YC’s Demo Day is an incredibly valuable tool for startups. The reason is that a higher density of meetings dramatically changes the results of your fundraising efforts. Having 100 meetings with VCs over 3 months will not be as effective as 30 meetings in one week.

So to simulate Demo Day for your next round, make your fundraising a punctuated event. Don’t take investor meetings if you’re not fundraising. No one will think less of you if you say “thanks, but we’re heads down building our product and plan on fundraising on X”. Don’t even take intro phone calls if you find it hard to be disciplined here. Then when you want to fundraise, try to plan all your first meetings within just a week or two.

If you don’t have the YC investor network, leverage your personal network. In a spreadsheet, make a list of every investor you know. Then make a list of every founder you know. Ask every founder which of their investors stand out, add those to the list, and then ask for an intro. Make a list of other notable investors and research who you know that can intro. Then request the intro and add the investors to the list. This list is now your CRM. Work the list to arrange a tight sequence of meetings.

I meet many founders that don’t understand the numbers here. That’s one of the benefits of YC’s demo day: default high scale. You can’t just take one meeting and decide your fate from the result. Plan on a large number of meetings and a large number of “no”s before you get to a “yes”.

Another part of demo day is pitch practice. The actual pitch is just a few minutes long, but this is abnormally short for talking to investors. Still, your core message should be very polished to match this level of refinement. The best way to get good is to practice. Record yourself and watch the recording. Refine and repeat. Ask friends that understand startups to give feedback — do it live or share your recordings.

A coherent story comes from refined thinking.

Growing and Using Your Network

YC’s community is very strong, built with a pay-it-forward culture of helping future founders. Batch mates have stronger rapport than across batches. But this pattern just mirrors how real life networking works: it’s all about trust. Certification by an institution can help build trust without direct experience, like trusting someone is good because they went to Harvard or worked at Google.

Without the institution to impart proxy trust, the way to build a network is by interacting with people directly. There are plenty of navel gazing startup events with vapid conversation. I’ve found that the best contacts come from environments that foster closer relationships and higher bandwidth interaction.

I recommend approaching this in a tactical way: learn more about something you need by tapping your current network to grow your network. If you need to learn more about sales, talk to your network to find and build connections with people that know a lot about sales. Do the same for other topics: engineering recruiting, managing a team, automated testing, building a brand, getting PR — whatever. Cold outreach also works. To get a better response rate, target people rising in their career but not at the top.

Consider Sharing an Office — Thanks Andrew!

A shortcut to getting a close group of founders is to share an office. YC actually recommends against this because having a space to call your own is important. I don’t agree, especially given how expensive that can be for just a handful of people.

Right now YesGraph is sharing space with another small startup called Esper. Esper makes software for executive assistants, an under-served market.

Esper’s founder is Andrew Lee, and we regularly commiserate and strategize about our companies. It’s a microcosm of a YC batch: two founders talking.

11082264_10152884761385805_8943615801667347342_o

What are Your Tactics?

I’m sure we’ve missed some tactics here. What are yours? Leave your answers in the comments or email me at ivan@yesgraph.com

If you want to get future posts about startups and growth, subscribe here.

And if you’re looking to grow your startup, check out YesGraph!

3 Things You Must Do Before Building a Referral Program

I worked on dozens of tests and optimizations of Dropbox’s referral program. There is an incredibly amount of work on product and engineering that goes into making systems like that to be so successful.

But where to start?

What if you don’t have any referral program? Here are a 3 things to do TODAY to get started.

1. Measure: Do People Like My App?

People tell their friends about things they like. Referral programs, whether incentivized or not, just make that easier to drive good performance.

So how can we measure whether people would even use a referral program?

Luckily, there is a very well understood marketing survey that literally asks, “On a scale of 1-10, how likely are you to recommend this to a friend?”

It’s called Net Promoter Score, or NPS for short. You take the percentage of respondents that answer 9 or 10, and subtract the percentage that answer 1-6. The thinking is that people that say 5/10 actually have a strong reservation that would make them not actually recommend the app — maybe even prevent a friend from trying it if it came up.

If you survey your users and your NPS is less than zero, I wouldn’t bother with a referral program. You might get some people telling friends, but not enough to justify the product engineering investment.

Another way to measure happiness is retention. Plot percentage of users retained by user age. This isn’t retention by calendar time, but measuring relative to the user’s signup date. If all your users go away, your problem is the quality of your product, not your top of funnel growth.

Sometimes higher density changes retention, but be very wary of making excuses for terrible retention. The simplest explanation is that you can’t read minds and didn’t correctly predict what people want you to build.

retention

If your NPS or retention are good, proceed. Side note: if you continuously survey NPS, prompt people that answer positively to use your referral program. I wish this were baked into survey tools. My friends at SendWithUs have a great template to try here.

2. Send a Basic Request for Referrals

Ok, so you know people like your product. The simplest way to test whether they would use a referral program is to ask them to refer people. But you want to make it at least trackable to get some insight here.

You can compose invite links that show the user they will get credit. Send an email to everyone asking for referrals, and make the invite link really obvious. This global link is often important in referral flows anyway, so get some practice on highlighting it.

yoursite.com/#invite?u=ivan@yesgraph.com

You can send this to all your users once. For a real program, make it part of the user lifecycle.

Here is what that email might look like:

letterhead

Hi [Name],

Thank you so much for using [Example]. We’re delighted to have the support of early users like you.

I wanted to ask if you could tell your friends about [Example]. It would help us grow and expand — and also help your friends get [simple value prop].

You can just forward this email, or just share this invite link: www.example.com/#invite?u=ivan@yesgraph.com

Thanks,

Mary McFounder

3. Decide to Invest More – Or Not

Now you have a great deal of evidence to understand your users and the potential for a referral program.

Almost any outbound email tool can templatize that invite link based on the recipient. Almost any analytics tool will tell you which pages people see. So you can track opens on the email, clicks on the email, and then clicks on the link. With a very small amount of work, you can track which signups came from your brand new referral channel.

Generally, this is how you should be running all your growth experiments: what is the least amount of work to learn as much as possible and drive the most results.

The same applies to everything you do downstream. Measure where in the funnel this invite flow break. Check out this post about the metrics I recommend measuring for any viral flow. Then come up with experiments to improve the results.

If your engagement with this basic referral program is atrocious, then the product or your users need to change. There is a chance that designing the referral program differently can make a big difference. But this test touches many users and should serve as a good baseline.

How should you decide to invest more? That depends on your product and competing acquisition channels. Judge from first principles whether this experiment was a success for you.

If you have questions about this post or growth, join the YesGraph growth community on Slack: http://community.yesgraph.com

Or just email me: ivan@yesgraph.com

Building a Perfect Mobile Share Flow

UPDATE: We’ve launched our iOS SDK. READ MORE HERE. It doesn’t include branch.io integration yet.

Screenshot 2015-04-28 12.38.05

We’re building something new at YesGraph, and we wanted to let you know early because you can get involved. It’ll be 100% open source.

Mobile apps have a choice for share and flows: build their own or choose the native flow. The native flow is a pretty horrible experience, but building your own is a lot of work.

We also want to make it easier to use YesGraph. We want to make using our API easier than doing anything else. Our standard is the native share flow — it needs to be just as easy but with far better performance.

So we’re going to build an SDK for iOS that manages the sharing and invites. We’ll have connecting to a mobile address book, and we’ll use YesGraph contact ranking to drive a huge performance book there. This is the next step after building a Python SDK to use YesGraph.

It turns out our friends at Branch Metrics have already built a flow that has a lot of things we like. So we’re going to enhance it with YesGraph’s API. Go see the fork here on Github. The original repo is here. This means all the links sent can be wrapped with Branch deep links. Bonus!

We’ll also optimize the experience for sharing with a few design changes. This is going to be a work in progress that gets optimized with behavioral data over time. We’re following a pattern started by Stripe, who made an optimized embedded checkout flow. We love using that, and want to make a similar flow for sharing. You can expect Android, web, and mobile web versions too.

We need your help. We want feedback on how to package up our API wrapper and on how people want to customize and tune this flow. Please get in touch on Github or at support@yesgraph.com if you’re interested in helping.

We’ll also publish a few posts on this blog related to the effort. We’ll talk about the design patterns of what makes this flow work really well. Subscribe to get future YesGraph posts here.

Finally, we’re hiring for a mobile focused engineer. We think this effort is so important that we want someone on the team dedicated to building the best share flow ever. Email me at ivan@yesgraph.com if you want to help.

When to Layer Virality

Pernicious ideas around virality are too common. People think they can just sprinkle virality on top. People often think they need to work on virality really early when developing a product. The right answers are more textured.

Screenshot 2015-04-28 08.52.23

Activation and retention should be your primary focus. Don’t worry about top level growth. Don’t worry about K-factor or some other viral jargon bullshit. It is much simpler than that.

Just answer this question: “do people like my product?”

Activation is a measure of someone getting into your product to really experience it. At Dropbox, activation is measured by installing the desktop client and syncing a file. Mobile might be changing this, but for years it was an excellent measure. The reason is that almost no good users didn’t first follow those steps.

Onboarding is tricky, and getting someone to have a great first experience is an essential part of making them stick around, a.k.a. retention.

Retention is actually the most important part of virality. Go read this post of ours on the core metrics to any viral flow. The very first number I recommend tracking is what percentage of your users are sending invites. Practically, only retained users are sending invites.

If only 25% activate and 25% of those that do are retained, then your user base you hope starts inviting others is much smaller. It is easier to make activation go from 25% to 50% than it is to double your virality. Plus onboarding and retaining invited users still matters — so increasing retention increases the number of new active users you get from those invited via virality.

Exception: Density Impacts User Experience

There is an exception to this focus. Some applications have a dramatically different user experience when they are empty or full of your friends. Google+ is a bad experience because no one is on it, not because it lacks feature parity to Facebook.

How do you get density without being huge? Isn’t there a chicken and egg problem here?

The solution is to focus on density at the start. Facebook started at Harvard, Airbnb started in San Francisco, and eBay focused on niche products.

Alternatively, make a single player experience in your app that works without other people. Instagram made your photos look cool and easy to share to other networks before they had their own network. Dropbox syncs files across your computers before you had any shared folders.

Density can be achieved with community engagement or paid acquisition targeting a narrow area. It can also work with people inviting friends because friends tend to be in a cluster.

For YesGraph, we have a network effect with data not with people. The more we see, the better we perform. Luckily, we have a “single player experience” that helps us understand your data without needing to see all the data in the world.

Exception: Density Impacts Operations

If you’re working on an on-demand product, often times the density will affect whether your business is viable or not. You often have fixed costs proportional to peak load, meaning low density might cause negative unit economics. You lose money per transaction. With higher density, that can be flipped, so that your fixed costs help you scale really fast. 

This and the previous example are both network effects, and you need a way around them. Most on-demand services start in a single city, even a single small area within a city.

Make Sharing and Invites First Class

If you do think being social is an essential part of your experience, you must make it a first class citizen. You must make the sharing and invite features so central to your app and so obvious to use that almost everyone in your app does them.

The best example here is probably WhatsApp. It’s a messaging tool that literally doesn’t work without others. There is a social network effect with no single player experience. Even Facebook started with building profiles for yourself.

The invite flow is so good it feels like a native experience. It is also incredibly easy to get into the flow — just try to message a friend.

YesGraph Helps You Grow

Our goal at YesGraph is to make your sharing an invite flows perform a better. So when you do focus on this, try us out. Here is how it works: we can recommend who a user should invite. We first process a user’s network, like their mobile address book, Facebook, or email contacts. Then we recommend the top contacts for the app. We adapt and tune the ranking for your app — whether it is B2B or something for consumers.


Subscribe to get future YesGraph posts here.