An Enormous List of Referral Tactics

I ran growth at Dropbox where I tested dozens of optimizations on the referral program. I now make YesGraph, which uses social graph analysis to help companies grow — so I constantly talk to companies about optimizing invite flows.

This post puts together a big list of things you should consider for your referral program. If you like it, check out YesGraph and also our class on driving growth.

#1 Set Expectations

Adding a referral program can be easy, but optimization can be a lot of work. So set expectations.

nuke

One problem here is growth experts that wag on about k-factor and other metrics that imply everything is going to blow up.

Most apps I’ve seen that pop spectacularly with virality are actually sacrificing product quality and end up coming back down to earth fast. These is even a name for it: the dreaded shark fin graph.

The good news is that there are a lot of tools that can help reduce the cost of achieving high performance. That’s why YesGraph is here.

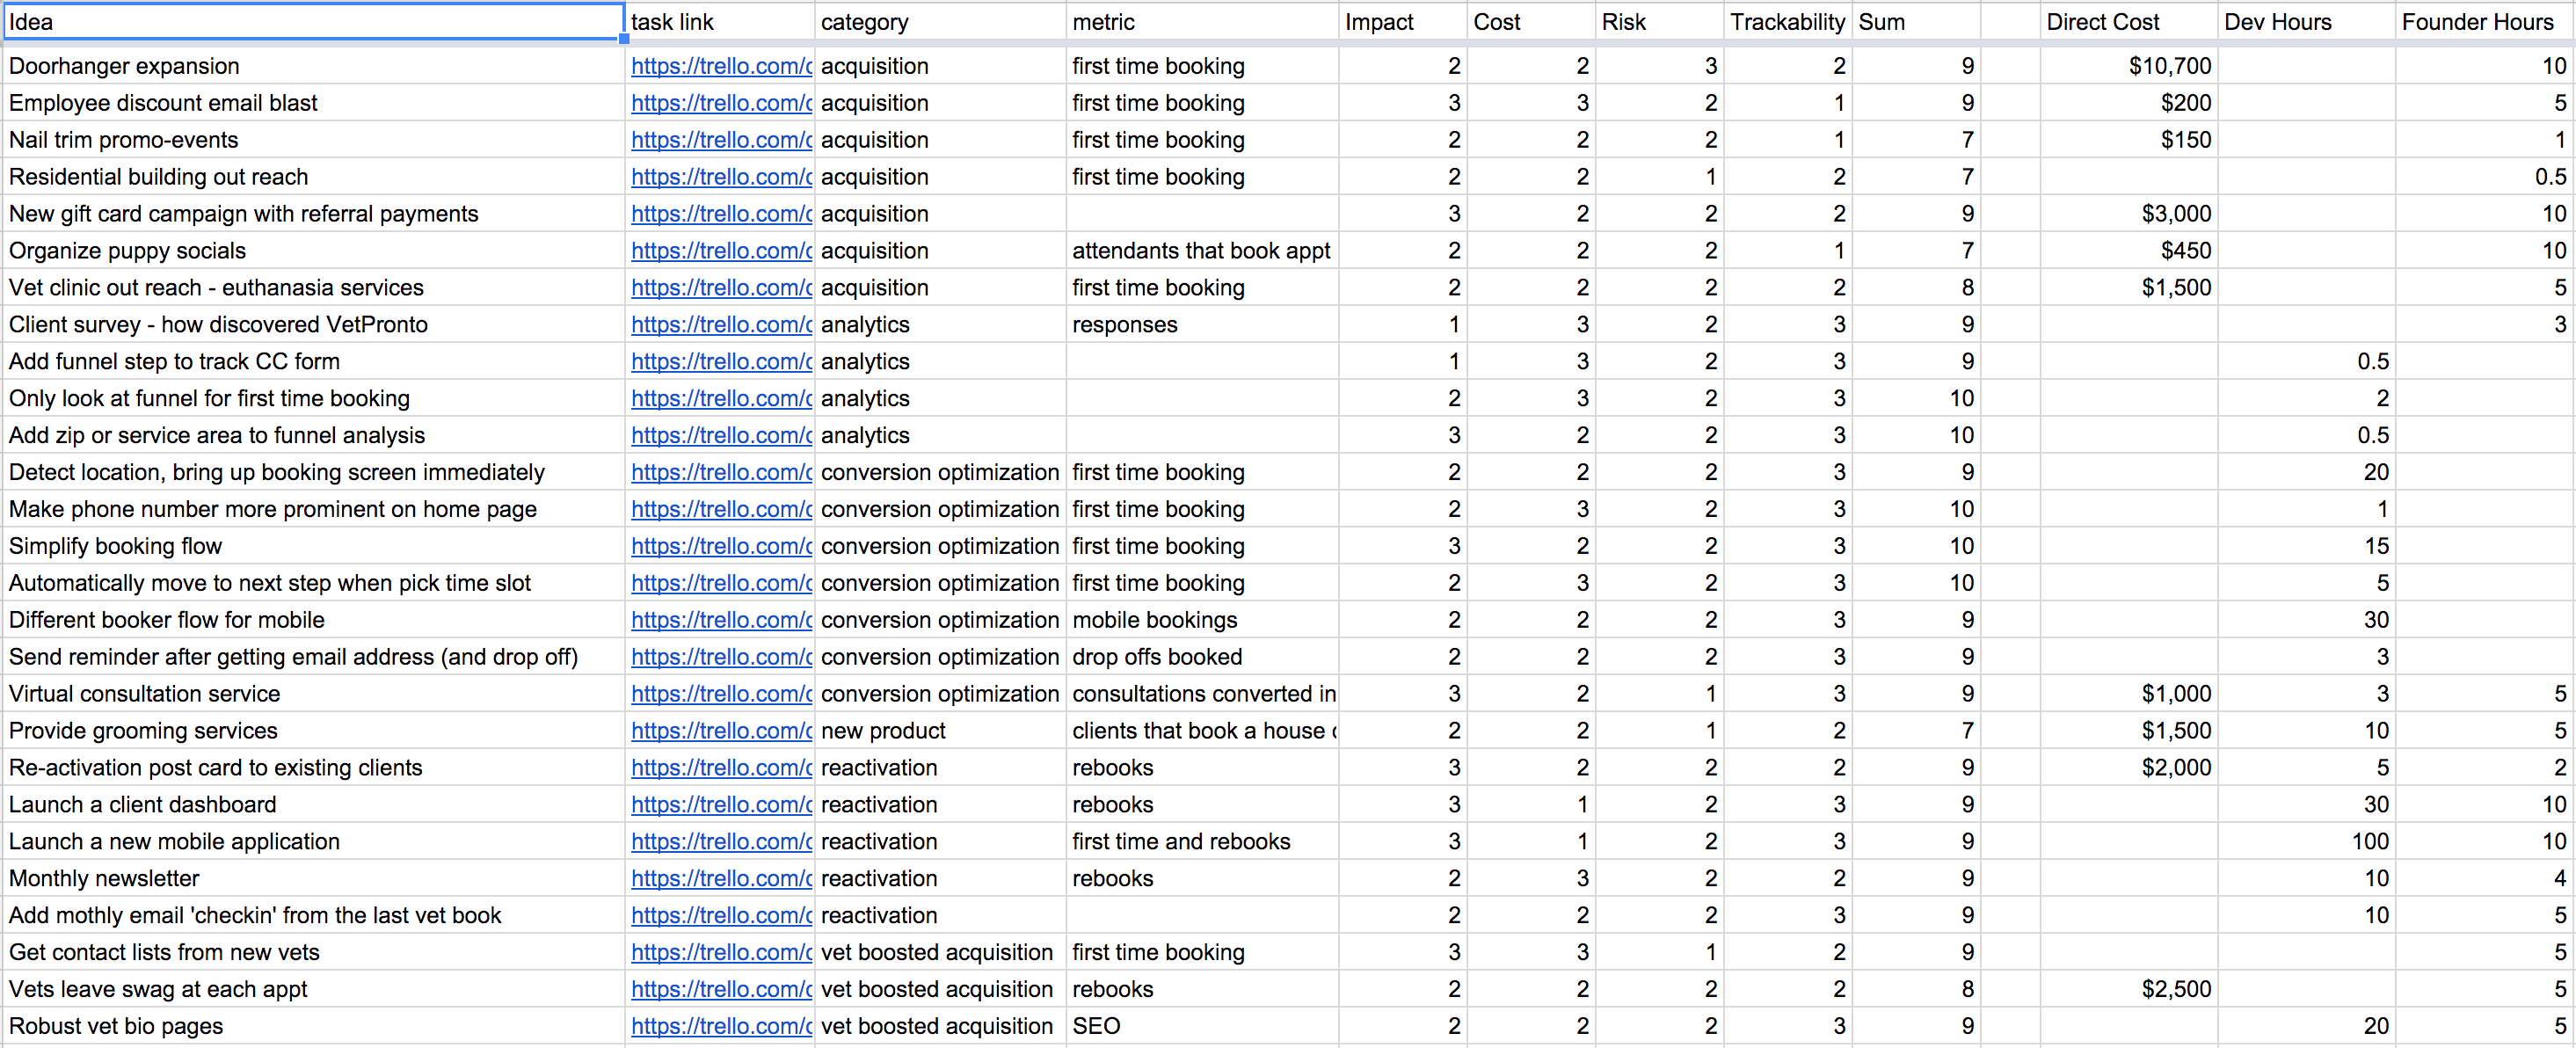
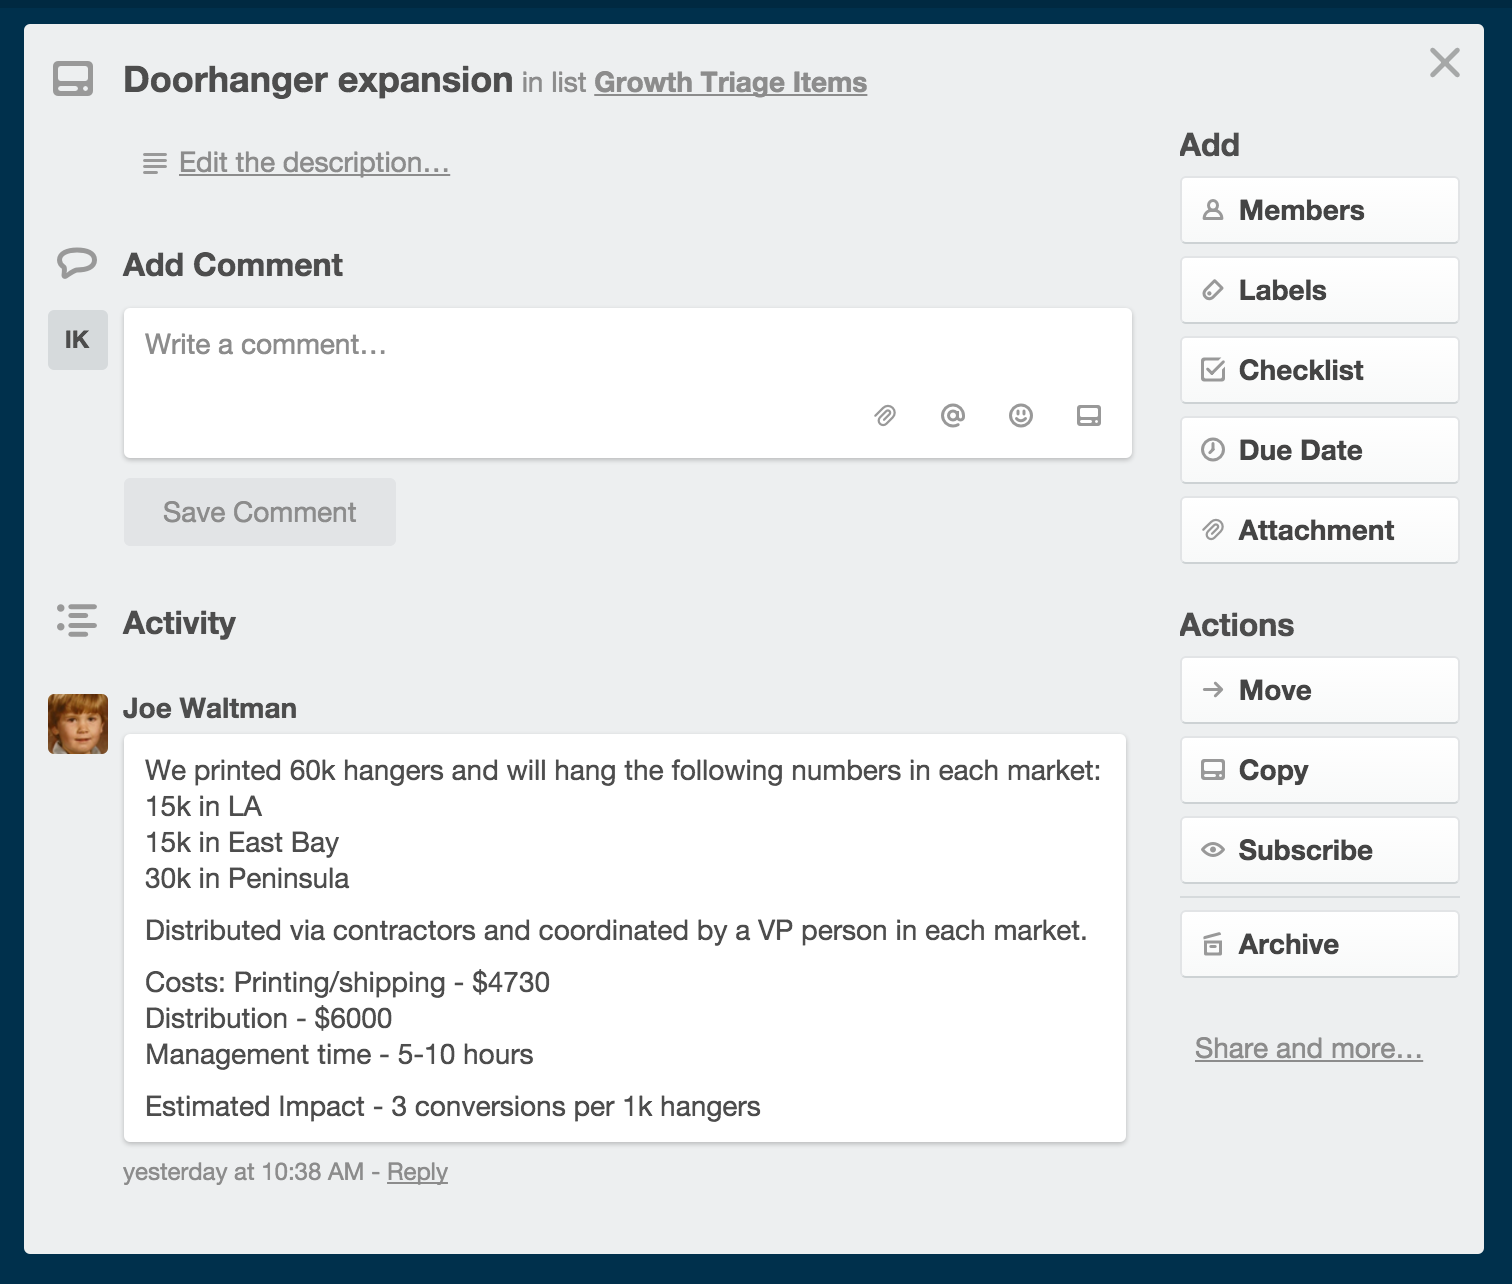
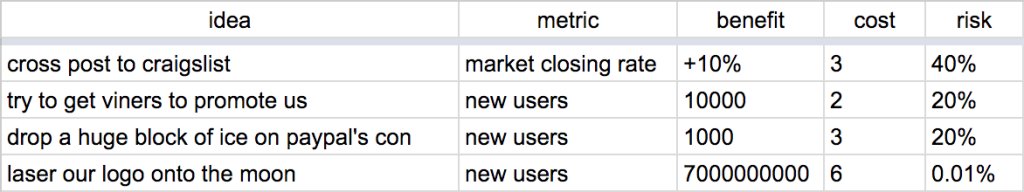
In our growth advice, we focus a lot on triage. You should take any bit of advice as a suggestion to include in your triaged growth roadmap and be wary of any posts saying “do these 32 things to grow”. That said, read on to see the rest of our 32 tactics.  ?

#2 Measure Happiness First

Before adding a way to tell their friends about your product, measure if they people like your product.

There is even a survey you can run that matches this well. The NPS survey asks “How likely are you to recommend this product to a friend? Why?”. That is literally what a referral program is asking users to do. Another way to measure is with behavior, namely retention. If people are retained, they like your product. We wrote more about this in our post: “3 Things You Must Do Before Building a Referral Program”

#3 Establish Basic Metrics

Your main performance measurement is growth. But you also need to measure your funnel.

The reason is to know exactly where you should focus your optimization efforts. This measurement and optimization theme is found throughout this post.

I like to look at these three:

  • The percentage of users inviting
  • The number of invites sent
  • The signups per invite

Read more in this post: “The Top 3 Actionable Metrics for Any Viral Flow”

The basics are important because they tell you where to focus your optimization. It might be that conversion to signup is low for invitees. It might be that people don’t even know you have a referral program.

#4 Make a Sharable Link

The first step to implement a referral program is to record the inviter when an invitee signs up.

Here are some example links from a few programs:

links

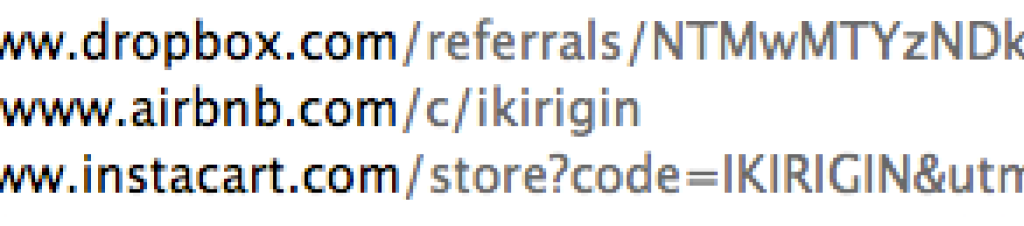
This is obviously really easy to implement. It’s just a url with some tracking. There are different ways to do it, and we’ll get to more of the tracking details later in this post.

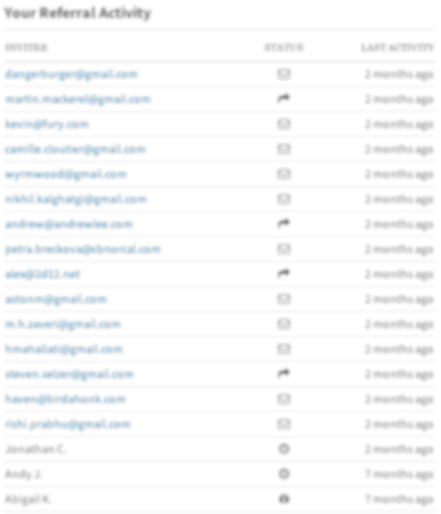
#5 Reflect Invite Status

Users of referral programs want to know whether an invitee signed up. You’re tracking it anyway, so show them.

This kind of reflection of status also helps motivate more invitations. It reduces load on your support team because so many questions will be about status and rewards. All it needs to be is a list of invitees and signups and what state they are in. Here are my Wealthfront invites.

reflect status

#6 Add a Symmetric Bonus

Symmetric rewards help lower the social cost of sending a message to someone.

I think people misunderstand what is going on here. Sure, getting a discount to a service is wonderful. Your users will probably love it. But for people that have never used your product, it might be hard to understand the value of the bonus.

The real reason an invitee signs up is because they got invited. That was the whole point. The bonus is marginal.

It’s the sender that is more interesting. They probably want the reward more, and making it symmetric means they feel like they are giving a gift. I’d like to see this rigorously tested to really know, and it probably varies from product to product.

#7 Avoid Money

Dropbox’s referral bonus of extra space is a wonderful virtual currency that avoids cents.

Just look at the math on Dropbox’s pricing. 2GB is Free. 0.5GB for a referral bonus. Paid is $10/mo at 1000GB. Compared to paying for a year, that 0.5GB is worth less than $5.

This is a cultural issue, but $5 doesn’t seem as much as 500MB. Plus you can invites lots of people and get 16GB, which seems enormous compared to 2GB.

The reason the GB and MB work is because they aren’t $$. This kind of virtual currency helps insulate users from counting pennies.

One thing going on here is market vs social norms. If you ask a lawyer to do pro bono work for a good cause, they might say yes. If you ask to pay them $10/hr instead of their normal $300/hr rate, they are more likely to refuse. Social norms help anchor us in interpersonal relationships. Once you bring in money, market norms start to take over.

If you’re asking users to invite friends, this matters. A virtual currency can be irrationally valued, like Dropbox space. And avoiding dollars and cents helps people avoid thinking they are shilling their friends for spare change.

Airbnb is a little different. Their average purchase is very high, in the hundreds of dollars. Users buy multiple times, so Airbnb is making $1000s. So their referral program is at a higher value, $75 for hosts and $25 for guests. That’s enough to start to be motivating. Uber’s driver referral program is even higher.

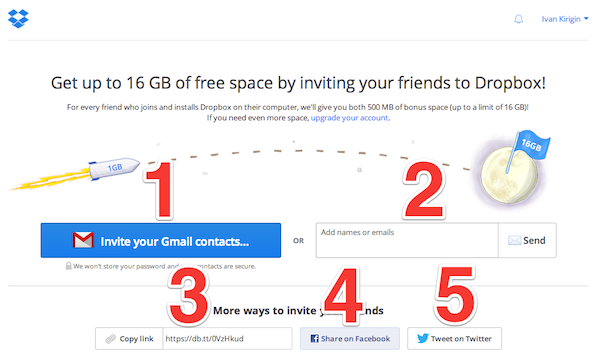
#8 Avoid Initial State Downer

Always consider your products initialization state. For referral programs, the mistake is a big fat ZERO.

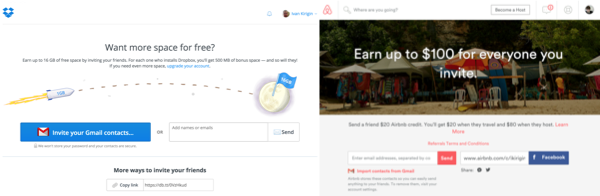
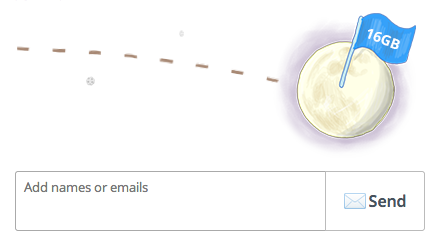
The copytext often literally says “you’ve earned $0” as a headline. For an initialization state, talk about what could be there. For Dropbox’s referral program, you’re the rocketship on the way to the 16GB moon.

bonus space

You don’t need a cute drawing though. Just change your copy text to be optimistic.

#9 Track By Channel

channels

You should track performance of referrals by the channel where the invite links are shared.

I see the mistake of not tracking all the time. It’s obvious because there is no tracking data in the link itself. The pattern will just be example.com/username.

Operationally, you know where to focus your optimization by looking at what is working and what isn’t.

The good news is that YesGraph is working on making this far easier for the web, building a one-line flow to add all these channels. Read more here.

#10 Channel: Global Link

global link

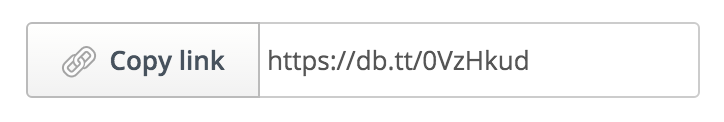
Call out the actual link to share because it gives users control of where they share it.

Often referral programs will hide the invite link, but that forces users to share on the channels you’ve created. Giving the user control means those with initiative will use the channel that is best for them, be it Facebook or Craigslist Missed Connections.

One detail here: make copy and paste easy. This will require a bit of flash to work. That flash is going to be a headache and eventual security vulnerability, but do it anyway.

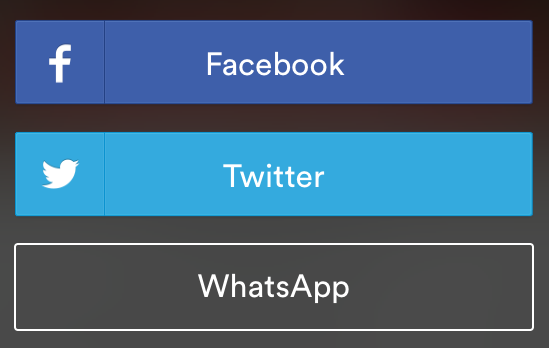
#11 Channel: Social Sharing

Static social sharing links are the incredibly easy to add.

social sharing

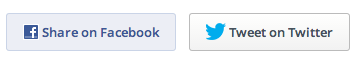
You can optimize each of these channels individually, and you should track how those platforms evolve. You can look at http referrer traffic to your landing pages to see if people are using a channel you don’t directly support. You should definitely test the copy of the actual message sent (like the tweet you use by default).

#12 Channel: Direct Email

Make it easy to share a referral invite by typing in an email directly.

direct email

These will be the highest converting invites of any channel because the filter to remember a friend’s email is incredibly high. You’ll want to focus a lot more on email once you look at the numbers here.

A common mistake here is making the input too rigid. You want to allow someone to copy and paste some blob of contacts. Just accept any input and parse out any valid emails. Users are lazy, and you should make it easy for them.

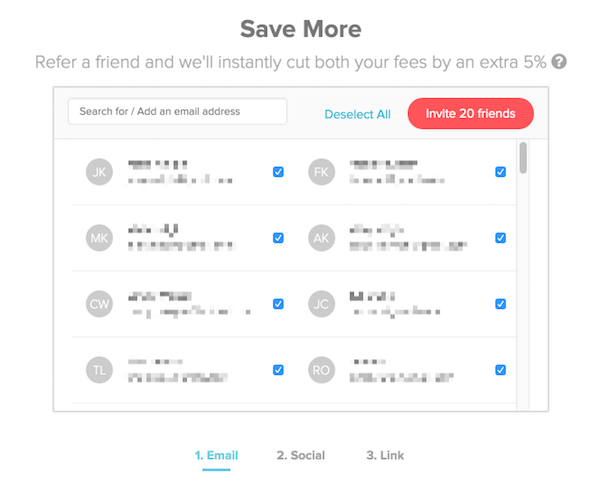
#13 Channel: Address Book + Suggest Invites

The most successful channel for every invite flow is the bulk contact importer.

The reason is that selecting friends from a list is far easier than remembering emails. So users select a lot more contacts.

Some apps have “select all”, but I think this ends up tricking users to send more invites than they expect. You’ll get marked as spam and your higher converting email channels will suffer.

The solution is to use YesGraph. Check out this example from Paribus, an early YesGraph user. YesGraph filters and recommends the most relevant contacts, and Paribus by default selects the top recommendations. Because YesGraph increases signal to noise, Paribus can dramatically increase their referral program performance.

paribusThis is all true on mobile as well, but the contacts come from the mobile address book. YesGraph’s iOS SDK make building this feature much easier. Mobile brings other issues too, like how you should send SMS messages.

YesGraph iOS SDK 100

#14 Channel: Local Messaging Services

On mobile, a user might have a niche messaging app that are ideal for that user.

local messaging

Take advantage of this by testing inclusion of those channels. This might mean including a link just for that app. On the web, this manifests itself with the long tail of email providers to import contacts.

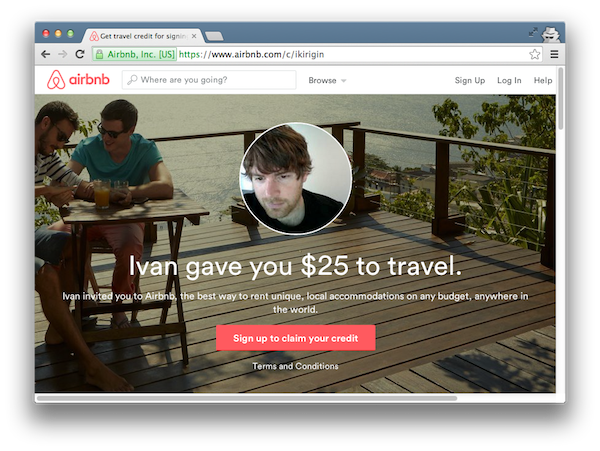
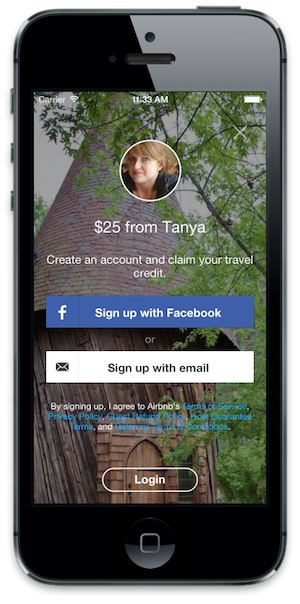
#15 Put Inviter’s Face on Landing Page

Customize landing pages with the inviter’s face and name because people just love faces.

It must be innate, because the stats here are just crazy. You should always seek to optimize your onboarding, but referral programs have the edge because the inviter is a big part of the experience.

The example below is from Airbnb. That handsome mug converts like crazy. ?

airbnb landing

#16 Mobile Custom Landing Pages

Custom mobile landing pages are less common but just as important as on the web.

The mobile onboarding experience can be a big of a mess:

  • Get a link
  • Click to a web page
  • Enter your phone number
  • Get an SMS
  • Go to the app store
  • Open up the app
  • Fill out a fat form

Anything you can do to make the pull of the app stronger or the experience smoother is a must to improve conversion rates. The specific flow that works best depends on your app.

For example, you might want web registration and then promotion of your app via email or phone number. Maybe you want to forward all web traffic to the app store and hope your landing page is enough to convert. Traffic on mobile vs on the web is probably different too.

But to get mobile pages to be customize by referral links, you need to use deep linking. This allows for a custom experience in the gap between clicking a link, installing from the app store, and opening the app. There are plenty of tools to help here, like Branch Metrics and Yozio.

We have something in the works at YesGraph for this, but it isn’t quite ready yet. In short, we can show a hell of a lot more of those clickable faces. Register to get updates on this here.

mobile-startup-referral

#17 Pre-fill Registration Forms

If you already have information about the invitee, make the registration experience easier by pre-filling the right fields.

dropbox pre-fill

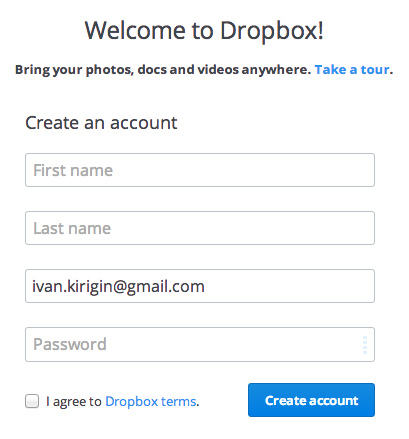
Apps don’t do this enough, and it isn’t clear why. You see this a lot with Facebook connect, where the user hands over a bunch of information and the app asks for it again.

A general conversion rate optimization tactic is to require less from the user to complete the conversion. It applies to lots of parts of your site, and to your referral registration page too.

#18 Measure with Comparable Metrics

To understand channel performance, break down the stats to have a common denominator.

Let’s take two examples: direct email vs Facebook posts. Here is each funnel and metric.

Email:

  • participation: users sending email invites / users visiting referral page
  • broadcast: # invites sent / users sending email invites
  • conversion: # registrations per invite / # invites sent

Facebook:

  • participation: users clicking on Facebook / users visiting referral page
  • broadcast: # visits to Facebook referral links / users clicking on Facebook
  • conversion: # registrations from Facebook / # visits to Facebook referral links

What if you took the product of either three. Then the units are the same:

  • # new users / # referrers

This is a viral coefficient. That’s awesome because you can now explain which channel is performing better. It could be that performance per participant is higher but that the share of users participating in a channel is smaller.

This is awesome data for experiments — maybe making the performant channel more prominent can increase overall performance. Or maybe it’ll cannibalize other channels. Test it and see!™

#19 Consider Editable Messages

Allowing users to edit invite messages might increase conversion to signup but might also decrease conversion to send.

Here is an example from Wealthfront. That app is a good example because people are so skeptical of financial services. So in their case they want to build more trust and get higher quality invites.

wealthfront message

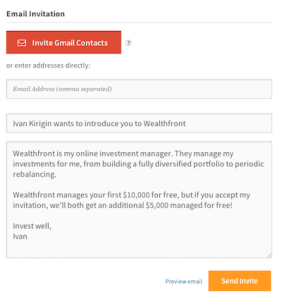
One issue here is how you allow for editing. Don’t include the actual invite link in the message. You’re allowing users to customize the message on top of your invite link.

This is actually pretty painful to implement. Rather than just keeping a list of invitees, you need to store the message too. And you now might have a spam vector, so maybe you want to filter the content. What a pain.

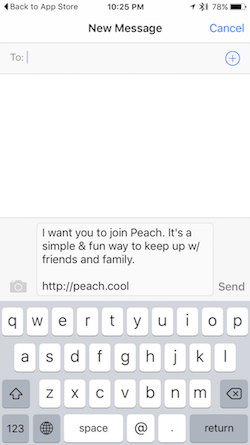
For mobile, this is actually incredibly common. The reason is that so many mobile apps just push users to send via native compose flows, like SMS. Here is an exampleI found yesterday from Peach. Note the lack of tracking on the invite link. Tsk Tsk, Peach. ??

peach invite

#20 Test Positioning

How you talk to your users about your referral program matters quite a bit.

Dropbox focuses on “Get Extra Space Free”. Airbnb talks about “the gift of travel”.

Some positioning include:

  • Give a Widget get a Widget
  • Get extra Widget free
  • Give the gift of Widgets
  • Go anywhere, stay for less!
  • Refer friends, get $X off your next Widget
  • Get credit

You can test what works best for your audience. If you’re more focused on brand identity (like Airbnb is), you could just mirror that ideal experience. For example, Slack says you should “be less busy”, so a referral program could focus on giving people more time.

#21 Track Placement

You should understand which marketing channels for your referral program drive the most usage.

This post has focused on which channel works when someone gets to the referral page, but how do users get to that page? How do they learn about the program.

You can go so far as to modify the invite link to track the placement. That way you can answer questions like “which promotion leads to the most successful referrals”?

I’ve seen this implemented as params on the link. Something like this:

/invite?code=kirigin&channel=direct_email&placement=email_01

#22 Placement: In your Header

Link to your referral program at the top of your home page.

This is very low cost. If shown to users that haven’t signed up, it can be really good priming. It might motivate signup and then also serve as a first touch before the user is ready to invite.

But generally only a small subset of users are going to be actively clicking on that link, so the total performance might be less than you expect. That’s true for all these placements actually. This is one reason why people have unreasonable expectations for referral programs. For some reason they assume a “if you build it, then will come” mentality. Nope, you need to earn it.

#23 Placement: in the product flow (Best)

The best place to promote your referral program is right in the product flow.

For example, if there is a social graph component to your app, giving some bonus to send invites would mean all users would participate.

This varies across apps and might come as a cost. For example, whenever there is a purchase, mentioning a way to get a discount on the thank-you post-purchase page could work. But there are often a lot of competing desires within your company for what belongs in that page.

One of the best examples I’ve seen is from Roll, another YesGraph customer. Roll is like Tinder for your photos, where you swipe up to share and down to not. Then you see a feed of photos from others where you swipe up to like and down to skip. Within that feed, they suggest specific contacts to invite: swipe up to invite, swipe down to skip. It works incredibly well as an integrated product experience.

roll embedded invite 200

#24 Placement: Literally In the Trough (Bad)

I see a lot of apps copy Uber’s rider referral program without considering that Uber is supply constrained.

They push hard to get more drivers. The demand side, the riders, was only recently optimized. The left-hand-nav trough of sorrow is not the best place to put your best growth channels. So don’t copy Uber. No one will see it and use it.

uber placement

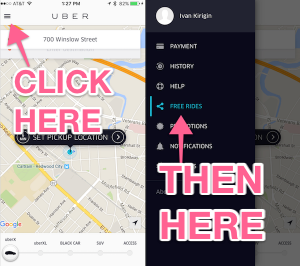
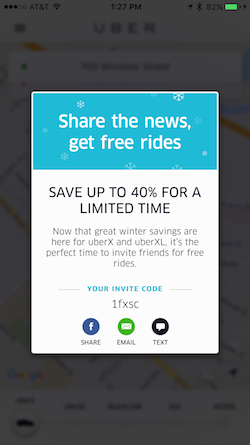
More recently, Uber has been putting prominent promotional modals right when you open the app. Even without seeing the numbers, this is obviously more effective.

uber new placement

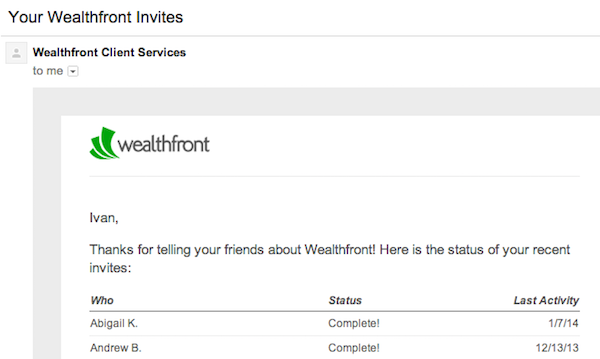
#25 Placement: Email Reminders & Invitation Status

Email users about the referral program repeatedly and include their past invitation status.

It’s important to think about user lifecycle here. It isn’t like someone signs up, sends invites, and then quits. For apps where users are more engaged (as opposed to transactional like ecommerce), the opportunity is to get users to share many times over months and years. So reminders help drive the repeat usage you want to improve performance.

Here is an example from Wealthfront. They manage money a bit like a bank, so their users are definitely engaged for the long term.

wealthfront email reminder

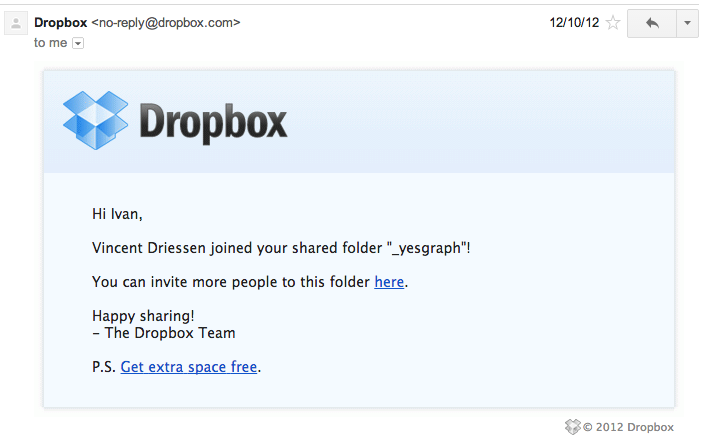
#26 Placement: Even more emails

If a notification email has a weak action, consider including a promotion of your referral program.

Here is an example from Dropbox, where adding “PS send more referrals” to lots of emails ended up driving a 13% increase in already-superb participation. This kind of promotion can come in lots of places.

dropbox ps

#27 Watch Effects upon Unit Economics

If you sell some physical good, watch out on the dynamics of unit cost and referrals.

Let’s say something costs $6 but you sell it for $8. Then you have a referral program that gives away one for free to the recipient. That means the recipient would need to use the product 3 more times before making back the $6 lost on the first purchase. It’s worse for symmetric bonuses, where the inviter also gets some credit.

It gets interesting when you look at how some of these VC funded companies are run. Sometimes things that cost $8 are sold for $6 to get an established user base. By that math, the less a new user buys, the less lost.

But these businesses aren’t crazy! Often they are heavy on logistics, and density of customers actually affect the unit economics. Costs like drivers, cars, distribution centers and bulk supply all change by volume. So by growing in a specific region, the unit economics can change from losing money to making money.

We wrote more about this in our post “When to Layer Virality”.

One product initiative at YesGraph that is exciting here is the location directed invite. What if a service would bias their invitation flow towards a new city that could turn on. It could be part of a city launch playbook and would affect time till the city is making money. If you’re interested in this, email us at support@yesgraph.com

#28 Fraud: Chill Out To start

If you’re giving something away, people might try to defraud you.

dirty-rotten-scoundrels

You might think you’re immune, but you’re not. For example, Dropbox just gives free space — it’s not like you can cash that out for some hard disks.

Fraudsters literally sell the ability to saturate your account with referrals. You pay them (instead of Dropbox) and share your Dropbox referral code, and then you get referral bonuses from their fake signups.

This can be a big deal, but for new programs, my best advice is to just chill out. It’s premature optimization to build a lot of infrastructure around fighting abusers before you know the channel even matters. This matches how security work is done anyway: you constantly need to adapt to the new attack patterns.

If you’re really worried about this, optimize your program on a subset of all your users and see if the numbers work at all. Make sure to normalize performance based on the size of the roll out. You won’t grow as fast, but you can stay in control. I think this is a bad idea, but go for it if you’re very concerned about fraud.

#29 Fraud: Increase Reward Costs

One of the easiest ways to fight fraud is increasing the threshold for granting a referral bonus.

For Dropbox, only users that installed a desktop client and sync-ed a file were counted. Some ingenious fraudsters found a way to mass produce desktop environments on AWS, so a lot more controls were put in place since that basic start.

But the pattern is a good one to copy. In Dropbox’s case, the activation of a signup was required, not just the signup. This is great for your app because you’re biasing towards getting better users. You can even involve your inviters to the game. If there is just one more thing the invitee needs to do, tell the inviter to tell their friend to do it.

#30 Fraud: Watch Cannibalization

Would your referral signups have signed up anyway?

That turns out to be a hard question to answer. In some cases it might be that a friend is with a user, and before the friend signs up, the user asks to use the referral program. Imagine two people waiting for a cab, and one tells the other to get the Uber app.

Measuring how often this happens is hard because it involves in person meetings and communication outside of your app.

One rigorous way to do it is to not send the actual invites to a test group. The percentage of people that still signed up could approximate your cannibalization rate. In my experience, it is a small concern, and not one to even bother measuring like this.

Even if it were cannibalized, you should consider relative acquisition costs. Not the cost per user but the cost compared to other acquisition channels.

One common error people make is including a prominent “coupon code” field on a checkout form. The first thing that I do when I see that field is google it to find a code, increasing cannibalization. Instead, just ensure that the links shared include the code, and make the coupon code field a hidden part of the form.

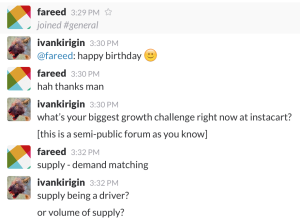
#31 Marketplace Dynamics: Supply → Demand → Supply

Marketplaces where the demand and supply side can be the same people are great for referrals.

Think of services like Kickstarter or Airbnb. On Airbnb, a user can be a guest, have a great experience, then decide to be a host. If someone invites a new user to be a guest, they can eventually help both sides of the platform.

Airbnb has baked this into the program by having referral bonuses change for guest vs host. But the flow isn’t different, it’s literally the same web page.

Other apps like Uber are more one-sided without as much transfer in their marketplace from demand to supply, and so their bonuses are very lopsided and their flows totally separate.

At the very least, you should measure this effect to see how many invitees eventually cross over.

The good news from an engineering perspective is that the mechanism to have one user send an invite to another is shared regardless of whether the flows are unified. These features can be re-used to great effect, especially when you triage by cost/benefit. This is why we’re excited for YesGraph’s SDK on iOS, Javascript, and soon Android. By making the mechanism easier, more apps can have great flows for more features.

#32 Track others

The ideas in this post came from following a bunch of great companies and running experiments myself. You can do the same.

Look at how competitors and apps you love ask users to bring in new users. My camera roll on my phone is full of screenshots from the apps I try.

You should take these tactics for what they are, suggestions and shortcuts. Always ask what would be good for *your* users and *your* market.

We’re here to help. Subscribe to get updated posts on our blog here. 

If you got this far, and want even more, we’re launching a class about growth too!

Keeping Score in Growth

curry 600

Good growth teams live and die by their numbers.

This is by necessity. Technology creates unfair advantages where first place is 10X bigger than 2nd and the rest combined. It’s true for Google, Amazon, Facebook, and other companies already founded today whose name we don’t recognize yet.

Startups without growth are dead, and the teams tasked with driving growth need to keep score to do their job.

This isn’t just about watching a graph on a dashboard. It’s actually crucial to good decision making. Growth teams should have a clear objective and have understand what levers affect their goal. They should triage ideas by cost, benefit, and risk.

This triage is central to a product team, answering a basic question: what should we do?

Keeping score is the best way to build up a stronger intuition and a comparable history of past projects to help you figure out what to do.

Start Right Now

Take an active project and ask: what will impact might be?

Write it down and share the hypothesis with your team. If you’re working on something without a clear objective, stop working on it. If you don’t have data yet, estimate.

Often you’ll even change how you work in order to measure this result. For example, the best way to measure impact is to run a parallel test with and without the change. Measuring changes in series is a lot harder because of conflating variables like seasonal changes, a PR hit, or a million other things.

The feedback loop starts when you measure how it went. Were you overly optimistic or pessimistic? In what time frame? Where there any side effects?

It’s also crucial to ask why. This is especially true if the test didn’t work. You had a hypothesis, the data has proven it wrong, and now you need to rebuild your intuition that created that hypothesis.

A virtuous cycle starts when you measure results. If things went up, you directly win. Either way, you build intuition and understanding. Then when planning what to do next, you make more informed decisions. More things you work on start to win. You get better faster.

Harder Than it Sounds

These ideas sound simple. But in practice, I’ve seen problems on product teams keeping score.

The aggressive operators on growth teams want to move the needle. That makes the work fast and frenetic. The problem seems to be that people want to move on to the next task to get more done rather than dwell on the past and measure what you already finished. That is such short term optimization.

How & Where

When you’re coming up with ideas on what to work on next, write down why you want to work on them. Get quantitative with how specific metrics will change. For comparing tasks, a simple spreadsheet works fine.

When you’re digging into a project, elaborate on what will change and why. Idealy link to evidence like the past performance of a similar project. For example, if last time you launched a new feature and emailed your users about it, what percentage of users engaging with the email used the product? This data can be used to predict how a new product announcement might be received. This probably lives in a product spec, which for me is either an asana task or google doc.

Post launch, go back to that hypothesis. Revisit the product spec and write down what actually happened.

This is true for both costs and benefits, like the time it takes to get something done. Check out this great post by Joel Spolsky on evidence based scheduling for predicting how long something will take to implement.

There are other ways of keeping score too, and they might influence culture event more. If you routinely do standups or all-hands or Q&As, talk about real numbers and wins. That kind of succinct public record keeping helps everyone understand that you’re here to win and take the challenge seriously.

Ringing the Gong

Speaking of culture, there is a fun anecdote from Facebook. Like many companies, Facebook would celebrate product launches. The “move fast and break things” culture was very powerful, and celebrating big launches is part of encouraging that idea.

They had a huge gong. When a huge product effort finished and launched, the product, design, and engineering leads would get up in front of everyone and hit the gong. The feature management systems were really robust so they could literally turn on the feature for users right when hitting the gong.

But the growth team at Facebook was different. They bragged that they never hit the gong. The thinking was that if they ever worked heads down for months on a huge product launch, there was almost no chance the effort was worth it. They were all about the incremental improvements over time.

Don’t just copy Facebook – find what works best for your team and company.

Putting It All Together

This is the fifth post in a series about growth. Subscribe here to get the next post right in your inbox.

We’re also putting together a class on growth which covers this whole process and more. This will launch in a few weeks, so subscribe to learn more.

If you’re building a referral program, you must read this first.

Two of the best referral programs on the web are from Dropbox and Airbnb. Have you noticed that they look really similar?

referrals

The reason is that both growth teams that build them are constantly optimizing, and they’ve reached the same conclusion about what works well.

At YesGraph, we want to make it easy for anyone to have a world class referral program. Our API boosts performance by recommending exactly who a user should invite. But there is more to program than that — often a lot of product work to implement all these great features.

We want to make building a great referral program far easier. Today we’re announcing the YesGraph Javascript SDK — internally nicknamed the SuperWidget™?. On iOS and Android (launching soon!), we built similar SDKs to handle the whole invite flow.

We want one line of code to deliver the same performance as the Dropbox and Airbnb referral programs.

We need your feedback! We’ve put together a super short survey here or you can just email us at support@yesgraph.com.

There are lots of design decisions that will impact exactly how integration works. This is a great chance to get exactly what you want built, so we’d love to hear from you!

So go take the survey here: http://goo.gl/forms/JaAMftdDuv

Or just email us at support@yesgraph.com

Growth Teams Must Have Aggressive Parallel Execution

bolt 3

Who is the most aggressive person in your company, driving the hardest to hit your goals?

They say the most aggressive person should be the head of growth, with #2 being the CEO. Growth teams should be so aggressive and autonomous that the only person reeling them in is the CEO.

Your company picks a goal and knows how to move the needle by building a map of the product, analytics, and marketing. You come up with new ideas and triage by cost, benefit, and risk. Next comes execution. Execution needs to be aggressive and parallelized to drive as much learning and experimentation as possible. It’s a race for your life — your startup’s life.

So how do you do it? This is actually a question about how you organize your teams. It’s a question of company culture. We’ll explore these ideas in this post.

Growth Team vs Growth Managers

Should you have a growth team? Or should you have people responsible for growth on individual teams?

For a small startup, the answer is easy: the CEO is the head of growth. You need to know you metrics inside and out. You need to understand the strategy to get traction, and you’re probably the one executing on that mission. You need to deeply care about your customers and understand what makes them tick.

What about larger organizations? The answer isn’t obvious and it probably depends on how your current company is organized.

If there is a dedicated growth team, who triages the product roadmap for other teams? What rubric is used in that triage if not hitting some clear objective? Who owns the metrics?

If you have individual members responsible for growth, how do you test bold new growth ideas that take dedicated resources? How are lessons learned shared across your organization?

When designing the shape of your company, the important part is understanding these tradeoffs and making your objectives clear. You should experiment with changes that fit your company and see what works best.

In-House Growth Consulting

If I were joining a new company without a strong focus on growth, where might I start?

I’d go to every other team and ask two basic questions:

1- What are you working on?

2- What do you think will happen when that launches?

It’s shocking how many companies don’t ask such basic questions. There are a myriad of excuses — maybe focusing on quality over performance. Maybe thinking that a lack of corollary makes predicting the future hard.

Call this out. Prediction is hard, but that’s no excuse.

Going through a product development cycle with these questions in mind gets a company on the right track. After a launch, did things go as expected? Why not? What did we learn? What can you do next time? How can we organize our team in a way to deliver better results? If that worked, what can we do more to double down?

This is how a growth team thinks. Start by asking your product leaders some basic performance focused questions and keeping score.

Analytics Life Blood

Growth teams must make informed decisions to win. Early on, this might be qualitative data from talking to customers. At larger scale, aggregate behavioral data speaks volumes.

How are questions answered in your company? Put aside the mechanics, though they do matter. This isn’t about your analytics tech stack. If someone on your team has a product question, what do they need to do to get an answer?

Can they get an answer themselves? Do they need to be in good graces with Bob running the analytics servers? Do they need to know SQL? How are questions triaged? How are answers shared?

Build an organization where the cost of asking questions is as low as possible. Friction means some questions just won’t get asked and you’re on track to building a culture where data, even anecdotal from customers, isn’t needed to make decisions.

I’ve seen different organizations deal with this in different ways. Certainly there are instrumentation and exploration tools that can be bought or built to enable teams to answer questions. The collaborative side to these tools is the most interesting.

Dropbox at one point built a system jokingly called Coura. It was simple: ask a analytics question and say why you want to know the answer. When someone was ready to work on it, the system asked if the information was still needed. Anyone could see the other questions asked and their answers. Engineers were confident that the work they’d do to run an analysis was always needed and impactful.

At another company I helped, they built a system for managing complex queries over large data sets. One interesting byproduct was the ability to see the queries others were asking. This become an onboarding tool for product analysts. It wasn’t treated as such, but the teaching and sharing power was incredible.

Such social tools within organizations aren’t developed enough.

There are many vendors selling analytics tools and and business intelligence solutions. Their sales process and user interface distract you from the main issue in deciding what to use:

Product Needs Drive Analytics

Way too often, product teams dig into analytics tools and try to learn what the hell is going on with their product.

This is backwards. You need to start asking questions from the product side and answer in whatever way is possible. This often means writing custom code to get a real answer. This often means adding a new tool to slice and dice your data, or connect multiple data sources together.

Starting from the tool and working through questions doesn’t work well. The reason is that tools are general and not designed specifically for your company. They have a language, and not knowing your dialect means you don’t even think to ask your questions when you start from the tool.

For example, Google Analytics is very focused on pageviews. It doesn’t focus on users and their actions. If you started with GA, you’d be asking the wrong questions and working towards the wrong goals. If you focused on your product and users, you might then instrument the product with something like Mixpanel, and focus on what is really going on.

But even Mixpanel has some strong opinions. They are great at funnels and events. But if you launch a new feature and want to know how that affects retention, their cohort analysis tools aren’t as strong as Amplitude, an upstart analytics tool that focuses a lot more on cohorts.

Whatever the tool, the point is that you should focus on what is really going on with your customers and your product. Trying to understand that will yield questions that some tools can answer and others can’t.

Company Wide Performance Sharing

Some companies are really tight lipped when it comes to performance and revenue. The tide is turning here because there are huge benefits to sharing this information.

One of the easiest ways of building a more data focused product culture is to share performance data.

Dropbox did this with a daily metrics email. They built an in house metrics dashboard, and then took a daily snapshot and emailed it to everyone in the company. They included investors as well.

This has a huge impact on a company because you make what you measure. If you are measuring and sharing growth numbers, everyone in the company will internalize and represent those goals in their work.

This focus on performance was pervasive at Facebook. The whole company understood for years that the goal was to get everyone in the world on Facebook.

Product Specs Run Like Experiments

After you’ve triaged your growth, my specific tactical advice is to run each task as an experiment. You don’t need a PhD — just treat it like a 4th grade science experiment. Write down what you think will happen — something measurable that you can look at after the experiment. This is often a specific metric you hope to improve.

It’s crucial to reflect back on why your hypothesis was right or wrong. Digging into this helps you learn about your product and customers and informs your future product roadmap. We’ll cover this idea more in our next post about growth.

I really like the framework that Brian Balfour has put together here. Check out his talk here about how to run this experimental progress.

Putting It All Together

This is the fourth post in a series about growth. Subscribe here to get the next post right in your inbox.

1-  Pick a Goal

2- Map your Product to your Goal

3- Triage by Cost, Benefit, and Risk

4- Aggressive Parallel Execution (hello there!)

5- Keep Score (coming soon)

We’re also putting together a class on growth which covers this whole process and more. This will launch in a few weeks, so subscribe to learn more.

A YC Company’s Public Product Roadmap

ozzie 2

Last week we wrote about how to create and triage your growth ideas. Read more about our process here. Now we want to follow up with a real example of a startup’s roadmap.

I didn’t want to use YesGraph directly here, because I wouldn’t want the underdogs at Google and Facebook to copy us. But VetPronto is different. 

I first met VetPronto’s founders through YC. We were batchmates in the W15 class. So I was delighted when Joe from VetPronto reached out saying they were up for running a growth triage and publishing it.

VetPronto lets veterinarians make house calls for your pets. Book online, and a vet comes to your house when it’s convenient for you. As a pet owner myself (that’s Ozzie in the pic above), I know this is awesome. It’s painful to schlep your pet to an office just to wait for 20 minutes just to get a single pill or shot.

VetPronto isn’t overly worried about competition because their main problem is customer awareness. When someone books for the first time, they love it and switch to using them again and again, but most pet owners don’t even know this is possible. They’d be delighted if a competitor spent VC dollars teaching the world. So now you can read all their ideas freely!

Plus, they’re going to give a discount to all the growth focused pet lovers out there. Mention “YesGraph” when you book to get $25 off. They only operate in the San Francisco Bay Area and Los Angeles for now.

We followed the same process I recommend in our post about triage. We came up with lots of ideas, categorized them, and then estimated their cost and impact. VetPronto does a lot of ground marketing, like door flyers, so they also added “trackability” as a dimension. Ideas came from walking through the user flow, their current marketing channels that work, and brainstorming new marketing ideas.

Each of these ideas was put into a spreadsheet. Here is a snapshot, click through for full resolution.

Screenshot 2015-12-17 16.45.31

VetPronto likes using Trello, so each idea had a Trello card with more details. Here are two example cards, again click through for full res.

Screenshot 2015-12-17 16.46.07 Screenshot 2015-12-17 16.45.53

Triaging your growth puts your company in a position to work things that actually move the needle.

I’ve done this kind of product roadmap planning many times now. There are different ways to get it done, but let’s review the core parts.

There is far more you could do than you have the resources to do — whether you’re 1 or 1000 people. So you must triage. Triage by potential cost, benefit, and risk. Cost means both money and your team. Benefit means what metric will move if it works. Risk is an estimate of how likely it is to work. Run experiments using science: make a hypothesis and try to prove it right or wrong.

If you’ve run a similar process, I want to hear about it. Leave a comment below or email me at ivan@yesgraph.com

If you want to get future blog posts right to your inbox, subscribe here. Our next growth post will focus on how to organize your growth team to get as much done from your triaged list as possible.

And don’t forget to give VetPronto a try! They’ve been so generous with their transparency — Thanks to Joe and the whole VetPronto Team!

We’re Launching a Class: The Complete Guide To Growth

MIT

UPDATE: WE’VE LAUNCHED THE CLASS! FIND IT HERE: http://learn.yesgraph.com/courses/complete-guide-to-growth


I learned from the inside how Facebook drives growth and then ran growth at Dropbox. YesGraph incorporates some of these powerful ideas, but not everything we’ve learned can turn into a product.

This is why we’re so active writing about growth. For example, we think setting a clear, singular goal is very important. That isn’t a product, but a process for your product team. The response to our writing has been strong, so we’re doubling down.

Today we’re announcing a comprehensive online class on how to run growth.

We’ll cover running a process around growth, analytics top to bottom, deep dives into virality, and more — with plenty of examples and war stories.

If you want to get the class as soon as it is available in a few weeks, add your email here. 

But I have a big request! Tell me what you’d like to learn. If you want to know more about a topic or struggled with an idea, we want to add it to the class.

All you need to do is email me: ivan@yesgraph.com

Now let’s get meta. The way to make high quality products is customer feedback loops. This is a crucial growth understanding that we cover in depth in the class. This blog post is doing just that! Before we’re ready to show what we’ve put together, we’re already asking for feedback. So we’d really like to hear from you!

Growth Step #3: How To Triage Your Growth

So you’re trying to grow your app. You have lots of ideas. How should you triage?

We’ve written that Step #1 is picking a goal. Step #2 is building a map to understand how your product features and marketing can improve your goal. Then what do you do? This post is the next in our series about how to grow – subscribe to get all our growth posts here.

ideas

In short, come up with ideas and triage them by cost, benefit, and risk. It’s important to get the details right here so you’re running valuable experiments, so let’s dig in.

Crafting Ideas

My favorite nonfiction book is “Where Good Ideas Come From” by Steven Johnson. It’s a natural history of innovation — describing the environments where that produce good ideas. There are plenty of ideas in the book for how to generate good ideas. Here are few.

Gather information in a liquid network. This means talking to users and people at your company that understand your users and your product. What would they like to see change? You’re not going to work on everything you hear — so just gather the ideas freely.

It’s important to capture the why and not just the what. Often people jump to a specific solution of the problem when the real insight is describing the problem itself. The best way to get to the bottom of this is just asking why.

“Add Facebook for signup.”

“Why?”

“It would make filling out this registration form easier”

“Why?”

“Because you’re asking for a lot! This form is complicated.”

Study the adjacent possible. That means look to see what is possible by putting different parts of the world together. The airplane was the adjacent possible of the craftsmanship of bicycle mechanics and a light gasoline powered internal combustion engine. The simplest example of this for your app is taking an existing flow and trying to improve an element: a call to action, the copy, images, or the design. Or take an email campaign that worked for a past feature and apply it to a new feature.

Copy fearlessly but study first principles. An easy source of ideas is to copy tactics that others have tried. The problem is that what works for others might not work for you. Another problem is that you might be reading the distorted view of an outsider. A good example of bad copying is the way mobile apps bury a prompt to invite friends in a sub-menu — just like Uber does. Uber is a supply constrained marketplace and didn’t optimize the rider invite flow for ages — but dozens of apps didn’t consider that before copying them. Again try to copy the *why*. For example, Dropbox used referrals because the product quality was very high and most users came from word of mouth.

Dig into your data. Besides talking to users, there are plenty of data sources to understand what people do with your product. Sometimes you can find interesting behaviors. At Dropbox, we analyzed the file types and found that photos were popular and numerous. Talking to users showed managing photos is hard. This kind of understanding can help you immensely when you have far too many users to talk to personally.

Don’t just optimize what is there. Some of the greatest ideas are really different than what you currently do. For example, you can generate lots of ideas by walking through web user onboarding and thinking about how each step could be improved. But the best idea could be something totally outside that flow, like a mobile app that doesn’t exist yet.

Distribute across focus areas. Growth isn’t just about user acquisition. You should be concerned with retention and engagement and virality. For YesGraph, we define categories like “developer onboarding” and “ranking performance” and others. Base this on the map you’ve built to know what parts of your product impact your core goal. Making sure you’ve thought about your growth from different angles is a way to encourage lateral thinking and have better ideas.

Triage by Cost, Benefit, and Risk

You don’t need to get fancy about the tools you use here. Just use google docs or quip to make a spreadsheet full of ideas. Use a spreadsheet because you’ll be adding different dimensions, and a flat doc isn’t the best format for such side by side comparisons.

There are three categories.

Cost: how many resources will this take? This means the time your employees spend. It could also mean a dollar cost for, say, an ad campaign. People might have a category too: this might be front end heavy, that might be visual design heavy.

Benefit: if this works, what do we predict will happen? Having a hypothesis before you run a test is basic science, but very few people actually do it. Make an estimate of the impact of your work. This isn’t expected value, but conditional on success.

Risk: how likely is this to work? If you already have an analog, you can have higher confidence a test will work. If you’re working on something totally new, there is much higher risk. An example of a very high risk effort is forking off a dedicated app from your main app. An example of a very low risk effort is testing the copy on a button.

Screenshot 2015-12-11 09.13.11


Estimating the cost is probably the hardest part here because engineers are notoriously bad at figuring out how long something will take. The solution is to write enough detail about an idea so that each part is understood. Break down problems into component parts.

Spreadsheets are good for comparisons, but basic docs are better for more depth about a specific idea. So I usually have a doc full of stub specs. Eventually the stubs get their own doc for an even more product spec.

Balance Incremental With Potentially Explosive

80% of your tasks should be incremental, like running an AB test on an important form in your funnel. 20% of your time should be adding whole new, though risky experiments.

Incremental improvements matter over time. The reason is that if you’re working on the right things then the results are compounding. As we’ve said before, there is no silver bullet to solving your growth. You need to dig in and get to work.

Big risky, efforts can pay off, but being higher risk means that you are risking your company’s growth if you bet excessively on them.

The good news is often you can lower the risk by performing a small test. For example, adding a referral program has a lot of moving parts and takes some work to get right. It turns out you can validate the idea before digging into the hard parts. For example, you can literally add a single email asking users to invite others to see how your userbase would respond to a real program. Read this post for more details on referral tests.

What This All Actually Looks Like

I want to give an example of what this looks like, but a realistic view would require sharing too much of YesGraph’s internal roadmap. I love helping our community grow, but that is a bit too much transparency.

So let’s try something else. If someone wants our help in helping them walk through this process, get in touch: ivan@yesgraph.com. We can help you figure out the possible ideas and triage them. The caveat is that I’ll share your growth roadmap publicly.

We’ll see if we get any takers! What I can do is show what our internal docs look like – literally those pixelated images below.

I have one more thing I want to share here, but we’re not quite ready yet. If you want to see a more detailed breakdown of this process, subscribe to get future posts here.

Screenshot 2015-12-10 16.22.46

Screenshot 2015-12-10 16.23.59

YesGraph’s New Growth Community

Quick post! We’re running a community experiment at YesGraph! We’re inviting people to join a public slack channel to discuss growth.

Screenshot 2015-12-10 10.40.10

This can cover tactics, channels, metrics, and analytics.

There has already been some great discussion. My friend Fareed runs growth at Instacart and described how hard it is to keep the supply and demand side of Instacart in beautiful harmony. My friend Andrew is a founder at Esper, which just launched a cool new calendar audit tool.

I even just posted a referral to a contract growth marketer — a rare beast so your FOMO should be ringing right now.

Join the community here: http://community.yesgraph.com/

The #1 Mistake in Driving Growth

golden ticket

I’m privileged to talk to hundreds of companies about their growth. YesGraph helps recommend who a user should invite to an app, which is a growth power tool for referral programs and invite flows. Talking about your growth is part of our sales process.

Plus I ran growth at Dropbox, so I get a lot of people asking for advice. This is one reason I write this blog at all — I have a lot of say from this experience.

There is a common pattern among less experienced companies:

People think there is a silver bullet to solve their growth, they just need to find it.

No. Stop it. There is no silver bullet. There is no golden ticket. There is no magical growth hack.

Belief in this fantasy is actively hurting your company. It stops you from digging in and just getting down to work.

But Airbnb used Craiglist… Nope. Airbnb ran very many experiments. They visited their customers. They did things that couldn’t scale like great photography. They built up an amazing community of hosts that still is the hallmark of their brand. Airbnb didn’t have a silver bullet.

But Dropbox and referrals… Nope. I know the inside story here. Dropbox worked tirelessly to smooth out the rough edges of their product. They built something amazingly high quality and people wanted to tell their friends about it. I personally ran dozens of tests to optimize multiple sharing channels. Dropbox didn’t have a silver bullet.

The reason these complex stories get boiled down to something that looks like a silver bullet is because most media about growth and startups is junk written by outsiders. Another reason is that there is a natural audience for such thinking: hopeful founders who want to win. You see this thinking everywhere: money, dieting, dating.

The secret to driving growth is that there is no secret. You need to be humble, dig into your data, run real experiments, and drive to do it again and again. This is the message you’ll hear consistently from people that have done it at Twitter, Facebook, LinkedIn, and other high growth startups.

There are practical frameworks to use that can help run this process. There are many tactics you can use in experiments. That is what we cover on this blog.

For virality, we’ve written about what to measure, testing whether referrals might work, and when to focus on virality.

For growth process, we’ve written about the importance of picking a goal and building a map to understand how to hit your goal.

There is more on the way! We’ll write more about growth, metrics, and virality. High quality content around growth is rare, and our hope is to make it easier to build the next Dropbox or Airbnb.

Click here to receive future posts right in your inbox.

YesGraph’s New Pricing Model

rolodex

We’re really excited to announce YesGraph’s new pricing model. To date, we’ve actually been free. The reason was actually only because we were focused on building our core systems over building any billing infrastructure.

We wanted to make pricing simple and easy to understand. We also wanted to make our pricing very close to the value that you get from using YesGraph. So we’ll charge a monthly fee based on the number of Address Books in YesGraph.

There is actually a strong network effect around the data your app sends in. When we learn about a user’s social graph, it helps us better understand who to recommend for more of your users.

I’m really excited to support a free tier for projects that are just getting started. This one is tricky because nothing is free: customers on a free tier typically incur support and scaling costs. What if we dilute the experience of paid customers? We decided to take that risk because many projects start small and will grow with YesGraph. Plus, any friction that requires support is an opportunity to make the product easier to use for everyone.

You can expect some experimentation here as we find the model that best fits our products. We’d love to hear your thoughts! Email me at ivan@yesgraph.com

Subscribe to future blog posts here.